How to Build a Winning Sales Pipeline Dashboard


Anya Vitko
Contents
- Understanding the Sales Pipeline
- Essential Metrics to Track in Your Sales Pipeline Dashboard
- Step-by-Step Guide to Creating Your Sales Pipeline Dashboard
- Key Components of an Effective Sales Pipeline Dashboard
- Best Practices for Utilizing Your Sales Pipeline Dashboard
- Leveraging Technology to Enhance Your Sales Pipeline Dashboard
- Common Challenges and Solutions in Sales Pipeline Dashboard Implementation
In the fast-paced world of sales, having a clear and comprehensive view of your sales process is crucial for success. Enter the sales pipeline dashboard.
The sales pipeline dashboard is a visual representation of the sales process. It shows the stages a prospect goes through, from initial contact to closing the deal.
In this article, we’ll explore what a sales pipeline is, how to construct a dashboard that would provide the most useful insights into the sales pipeline, and how to most effectively act on the dashboard’s insights.
Here’s what we’ll cover:
- Understanding the Sales Pipeline
- Essential Metrics to Track in Your Sales Pipeline Dashboard
- Step-by-Step Guide to Creating Your Sales Pipeline Dashboard
- Key Components of an Effective Sales Pipeline Dashboard
- Best Practices for Utilizing Your Sales Pipeline Dashboard
- Leveraging Technology to Enhance Your Sales Pipeline Dashboard
- Common Challenges and Solutions in Sales Pipeline Dashboard Implementation
Understanding the Sales Pipeline
The typical stages of a sales pipeline include: 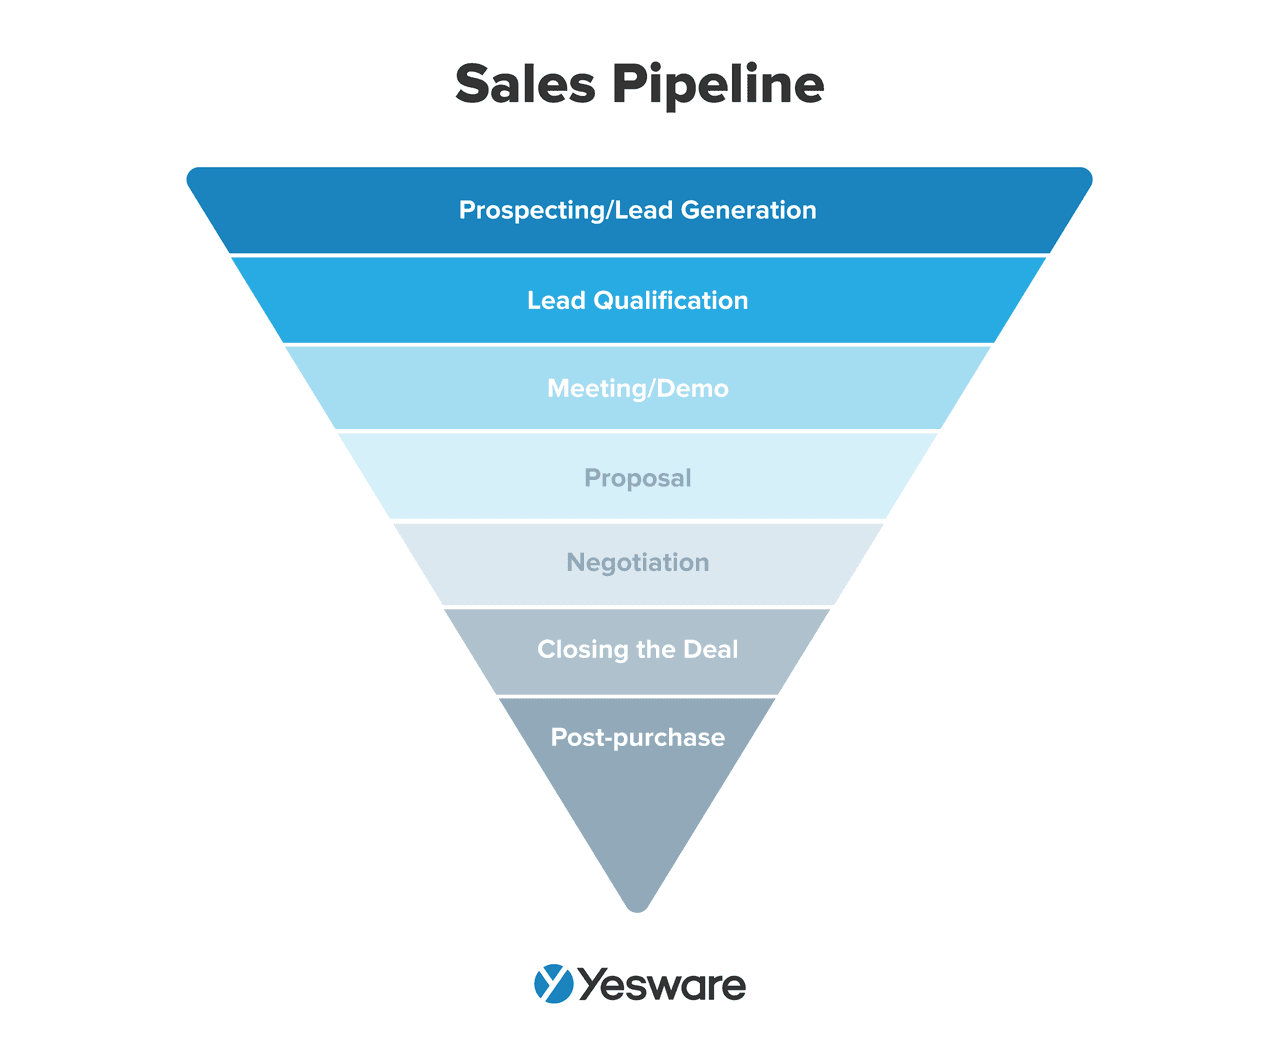
- Lead Generation
- Lead Qualification
- Initial Contact
- Proposal
- Negotiation
- Closing
- Post-Sale
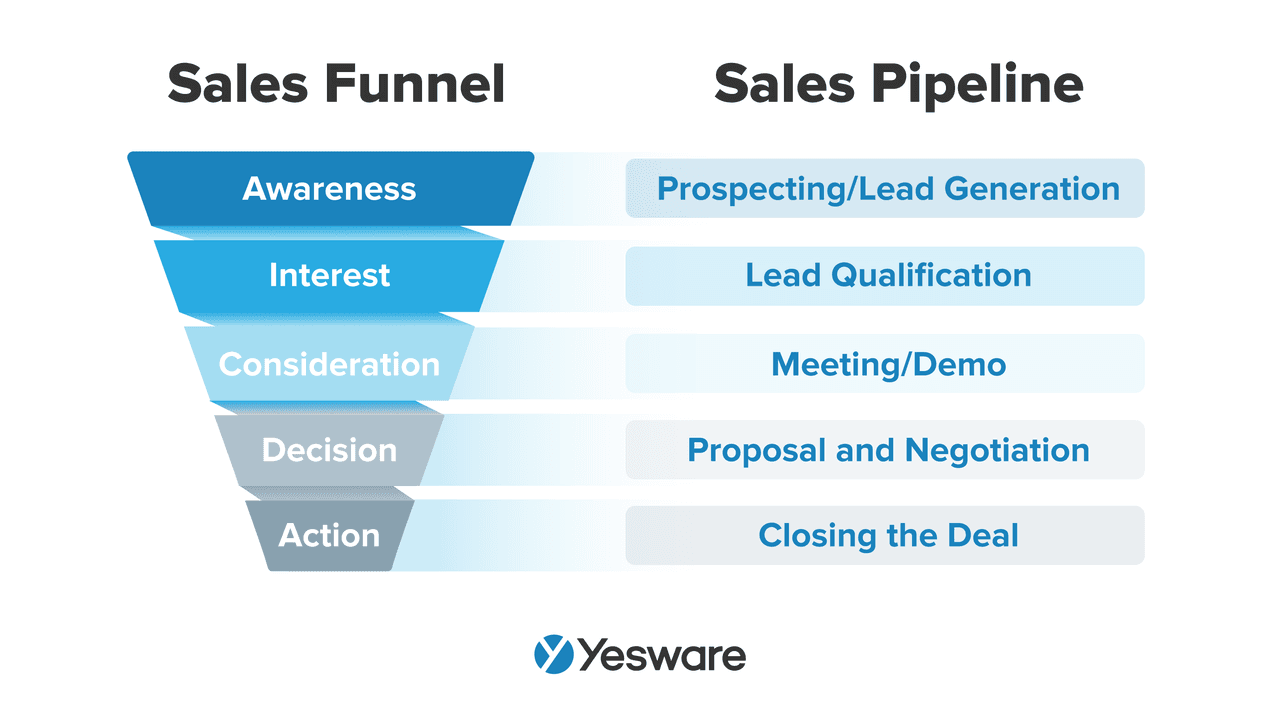
While the terms “sales pipeline” and “sales funnel” are often used interchangeably, they aren’t the same.
A sales pipeline usually represents the actions that the sales team ticks off to move prospects through each stage of the sales process until a sale is closed.
A sales funnel, on the other hand, represents the journey of a lead from awareness to purchase. It emphasizes the volume of leads at each stage and how many progress to the next stage. The funnel shape highlights the gradual decrease in the number of leads as they move through the stages, reflecting the attrition rate in the sales process.
Sales pipeline management is important for the success of your sales team. Here’s why:
- By conducting sales pipeline analysis, businesses can accurately forecast future sales and revenue.
- By closely monitoring and managing the sales pipeline, sales teams can implement strategies to improve conversion rates at each stage, such as coaching sales reps on active listening skills or how to perfect their outbound sales strategy.
- Sales pipeline management ensures effective lead nurturing.
Essential Metrics to Track in Your Sales Pipeline Dashboard
Using a dashboard is the most effective method for sales pipeline visualization. Determining what sales pipeline data your business needs in the sales pipeline report is one of the first steps in developing a CRM strategy. 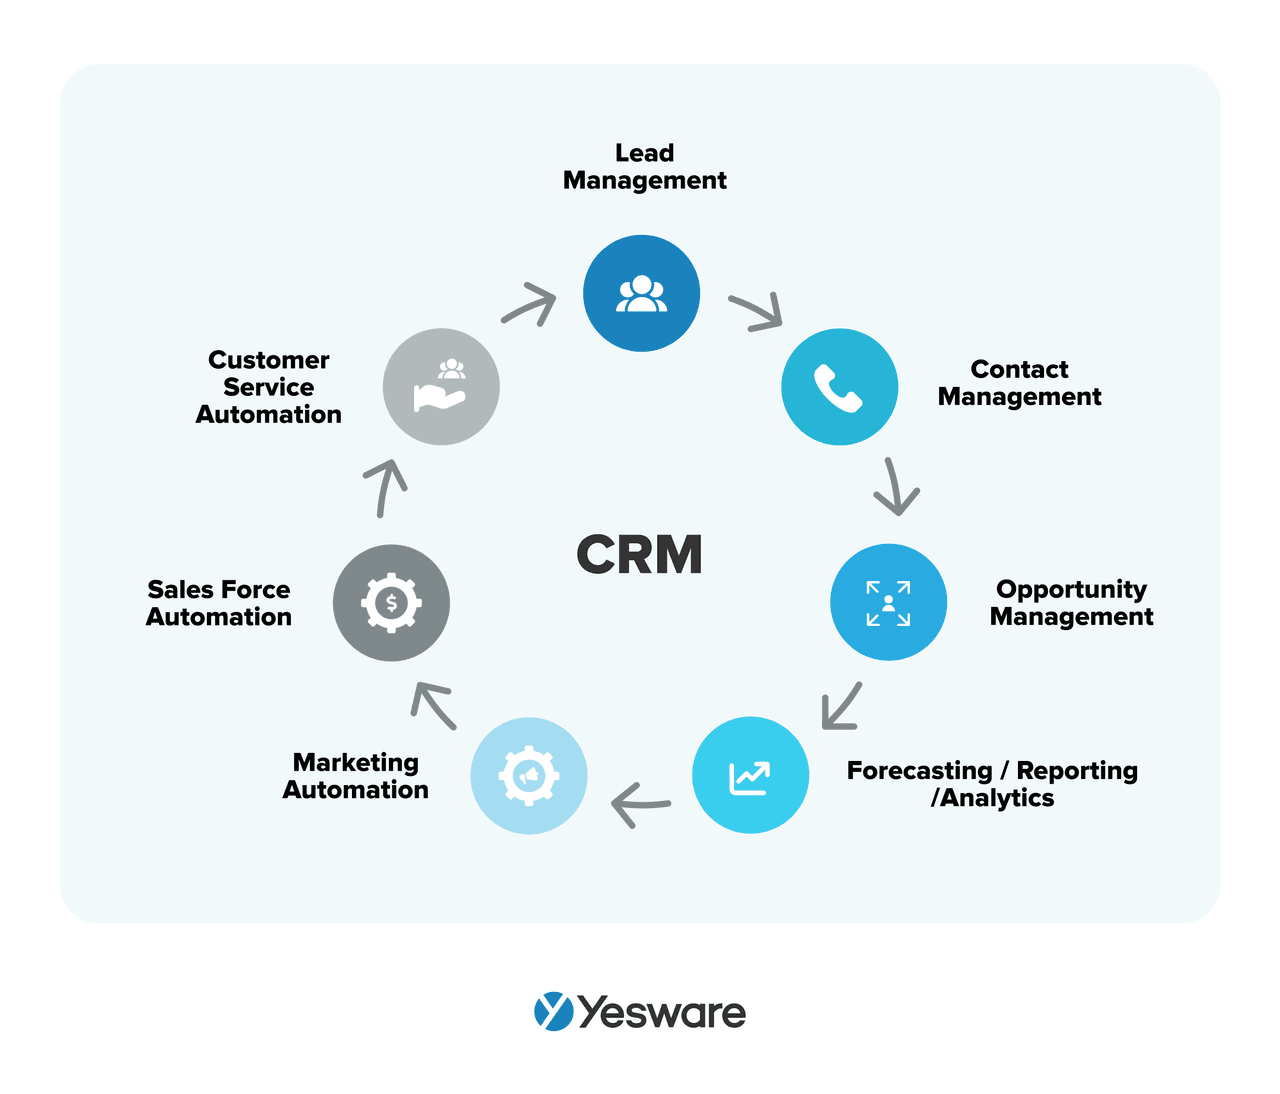
Lead Generation Metrics
Lead generation metrics help understand how effectively your marketing and sales efforts are attracting potential customers.
Number of New Leads
The number of new leads is a fundamental metric that indicates how many potential customers have entered your sales pipeline. Tracking this metric helps you understand the effectiveness of your lead-generation strategies.
To calculate the number of new leads, simply count the total number of new contacts added to your pipeline within a specific period.
Lead Source Attribution
Lead source attribution identifies where your leads are coming from, whether it’s through organic search, social media, email campaigns, or other channels. This metric helps you allocate resources effectively and optimize your marketing efforts.
To calculate lead source attribution, track the origin of each lead and analyze the data to determine which channels are most productive.
Lead Quality Score
The lead quality score evaluates the potential of a lead to convert into a customer. To calculate it, during your sales targeting process, assign points to various criteria and sum them to get a composite score for each lead.
Pipeline Performance Metrics
Pipeline performance metrics provide insights into how leads progress through your sales pipeline and where improvements can be made.
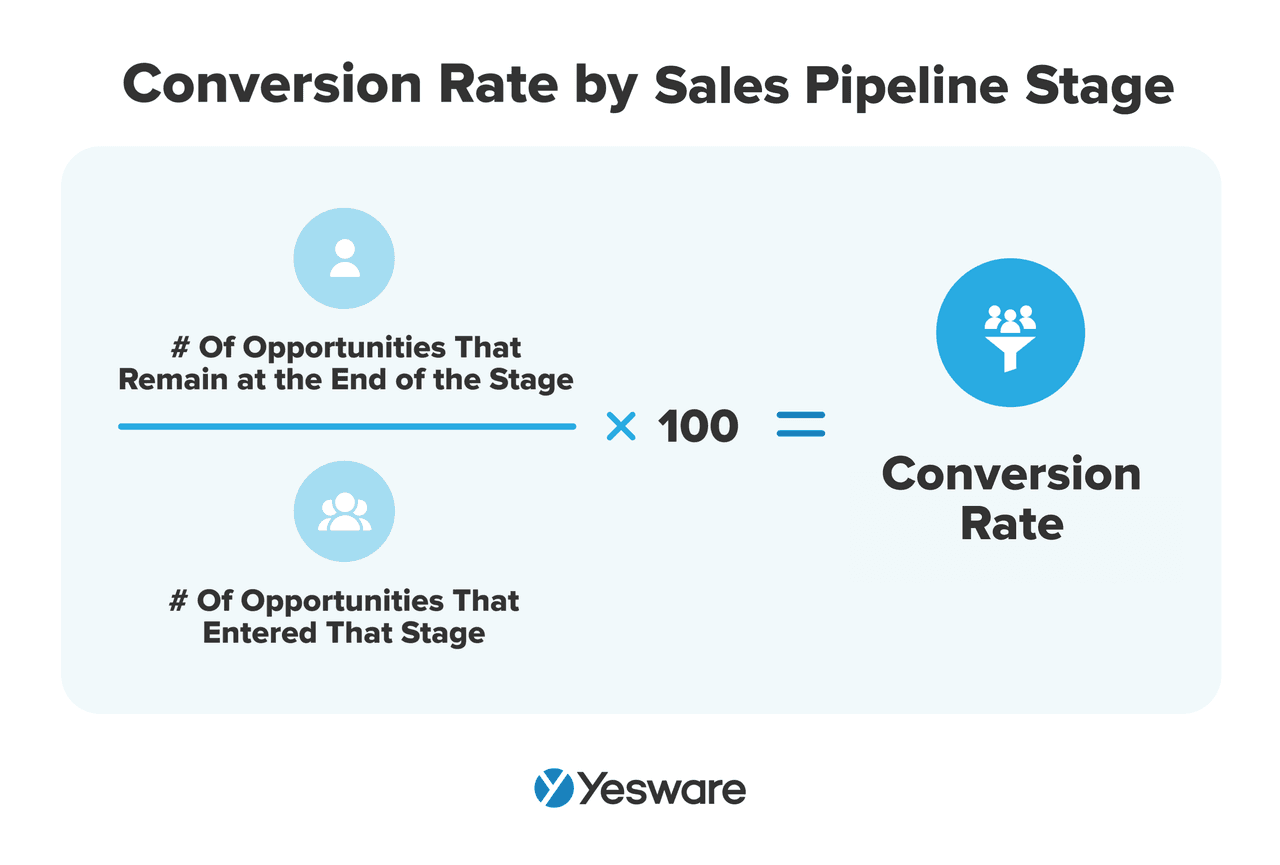
Conversion Rates Between Stages
Conversion rates between stages measure the percentage of leads that move from one stage of the pipeline to the next. This metric helps identify bottlenecks and areas for improvement in your sales process.
For example, it could be worth implementing a sales enablement strategy to coach your sales reps.
To calculate conversion rates, divide the number of leads that advance to the next stage by the total number of leads in the current stage, then multiply by 100.
Average Deal Size
Average deal size represents the typical revenue generated from closed deals. Monitoring this metric helps you understand the value of your sales and identify trends over time.
To calculate the average deal size, sum the total revenue from closed deals and divide by the number of deals.

Pipeline Velocity
Pipeline velocity measures the speed at which leads move through your sales pipeline. It is calculated using the formula:
Sales Pipeline Velocity = (Number of Deals×Average Deal Size×Win Rate)/Length of Sales Cycle
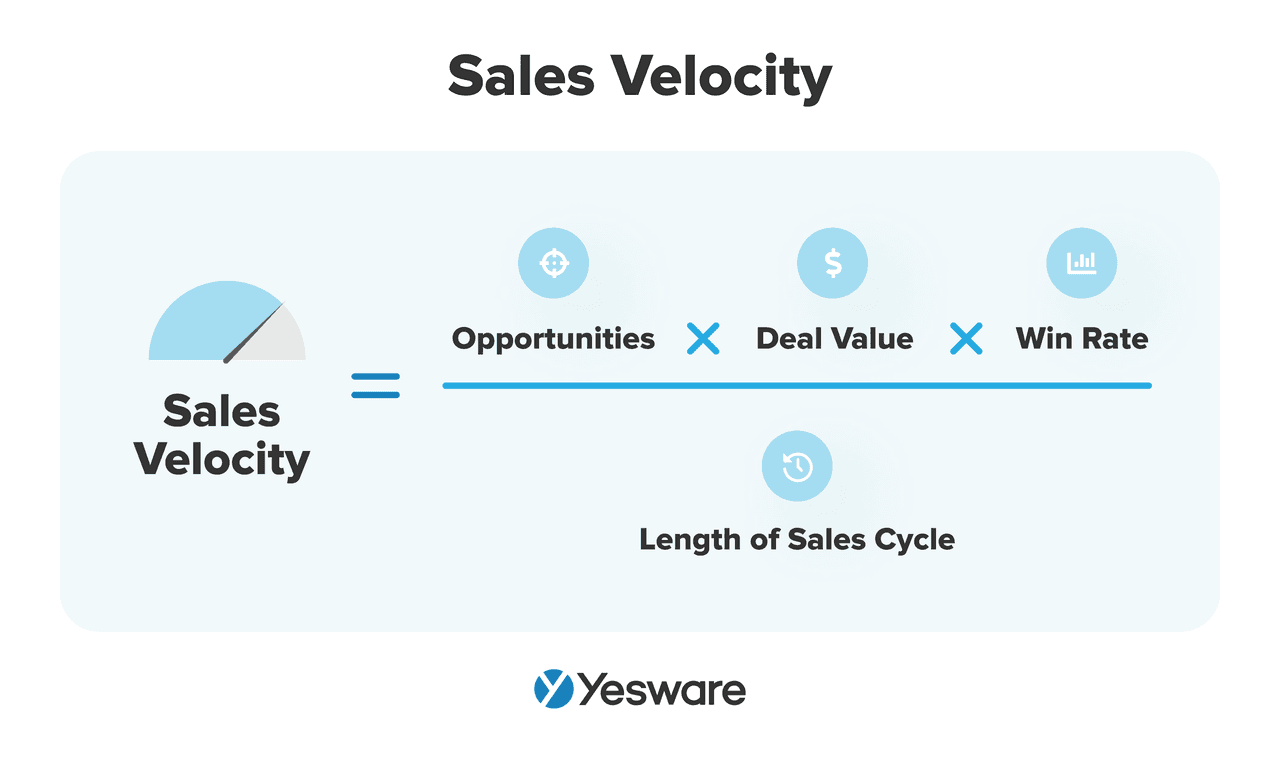
This metric helps you assess the efficiency of your sales process and identify areas for sales acceleration.
Sales Activity Metrics
This set of sales metrics is particularly useful for solving pipeline generation problems.
Number of Calls Made or Emails Sent
The number of calls and emails sent is a key activity metric that indicates how actively your sales team engages with prospects. Tracking this metric helps ensure that your team maintains consistent communication efforts. To calculate, simply count the total number of calls made and emails sent within a specific period.
Response Rates
Response rates measure the effectiveness of your communication efforts by tracking the percentage of responses received from calls and emails. To calculate response rates, divide the number of responses by the total number of calls or emails sent, then multiply by 100.
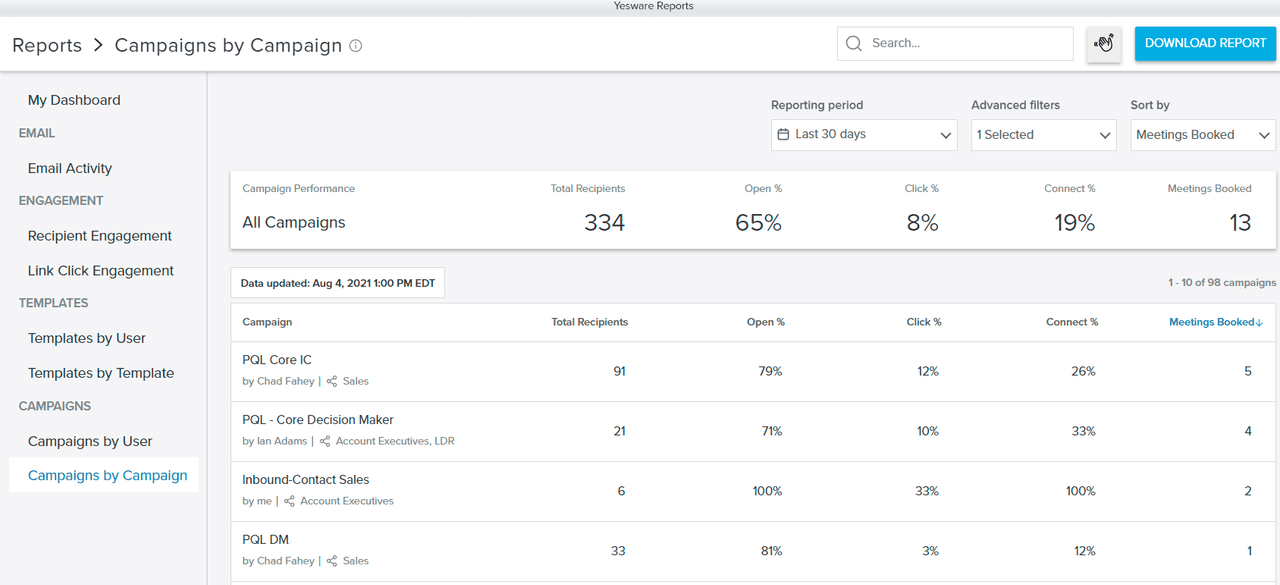
Tip: Find a tool that does it for you. Yesware reports on how well your templates and campaigns perform with visibility into your open rate, click rate, connect rate, and meetings booked.
Meeting Scheduled Rate
The meeting scheduled rate tracks the success of your outreach efforts in securing meetings with prospects. To calculate this metric, divide the number of meetings scheduled by the total number of outreach attempts, then multiply by 100.
Revenue Metrics
By closely monitoring and analyzing revenue metrics, you can ensure that your sales team is aligned with your go-to-market strategy.
Closed-Won Deals
Closed-won deals represent the number of deals successfully closed and converted into revenue. To calculate, count the total number of deals that have reached the closed-won stage within a specific period.
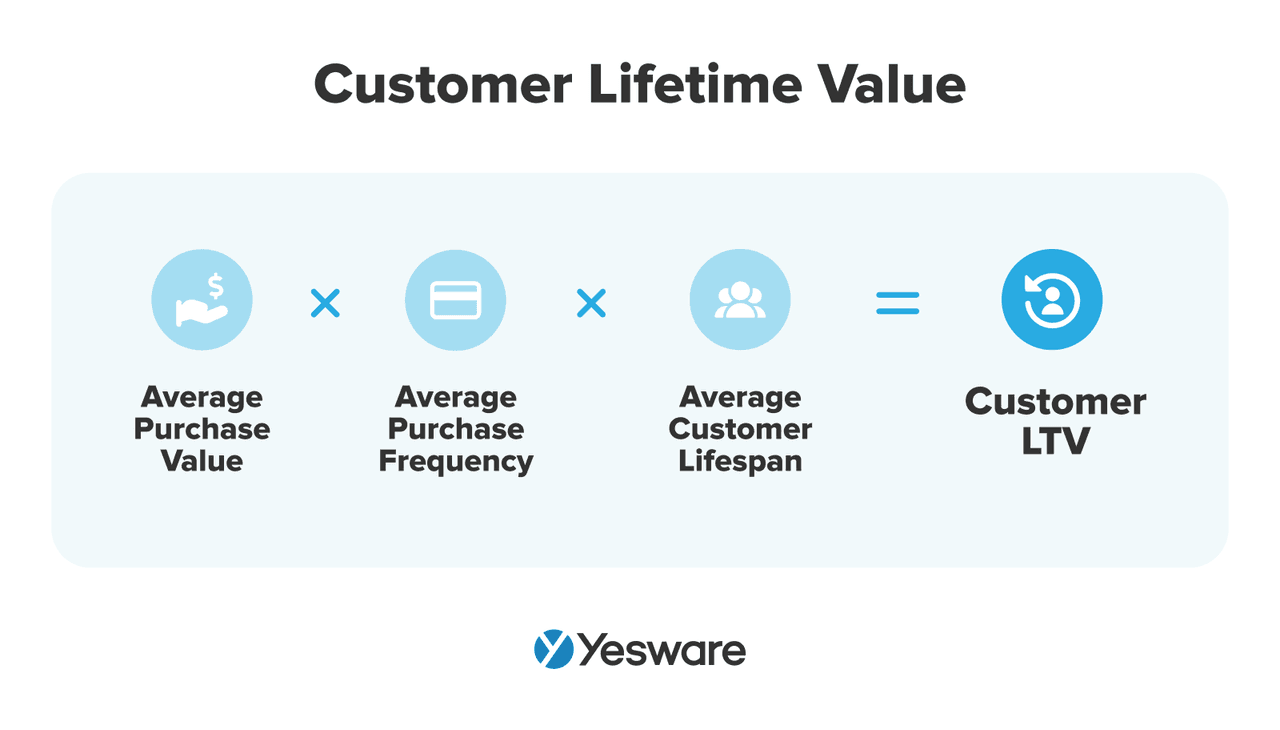
Customer Lifetime Value (CLTV)
Customer Lifetime Value (CLTV) measures the total revenue a customer can expect over the entire duration of their relationship with your company. This metric helps you understand your customers’ long-term value and informs your customer retention strategies.
To calculate CLTV, multiply the average purchase value by the number of purchases per year and the average customer lifespan.
Revenue Forecasts
Revenue forecasts estimate the potential revenue from your sales pipeline based on the current state of deals and their likelihood of closing. To calculate revenue forecasts, multiply the potential revenue of each deal by its probability of closing and sum the results.
Step-by-Step Guide to Creating Your Sales Pipeline Dashboard
The first step in creating a sales pipeline dashboard is to analyze your sales process. By mapping out your sales pipeline stages, you can ensure that your dashboard accurately reflects your sales workflow and provides meaningful insights into each phase.
The next step is to select the sales dashboard that will facilitate your sales pipeline management. Below, we will shed light on the most important features to look for in a sales pipeline dashboard.
Your sales pipeline analytics will not be successful without identifying and setting up KPIs tailored to your specific business needs and goals.
Here’s a recommendation on when each type of sales dashboard would be most helpful, the key performance indicators (sales KPIs) to include, and how often to use each dashboard.
A state-of-sales dashboard provides a high-level view of how your sales team is performing against their targets. Monitor the following KPIs daily and weekly:
- Total sales revenue
- Total deal amount
- Quota attainment percentage
- The accuracy of forecasts
A sales rep performance dashboard helps identify opportunities for coaching. Key KPIs to keep track of on a daily and weekly basis are:
- Conversion rate
- Total revenue generated
- Quota attainment percentage
A revenue forecasting dashboard helps predict future sales based on historical data and current pipeline information. Track the team win rate, average deal amount, average sales cycle length, and total pipeline value to identify how likely your sales team is to hit its overarching sales goals.
Once you set up your sales pipeline dashboard, you should gather feedback from your sales team on its usability and relevance.
Key Components of an Effective Sales Pipeline Dashboard
Let’s take a look at some important features to consider when selecting a sales pipeline dashboard:
- Is it easy to use? Does it clearly represent data?
- Does the sales pipeline dashboard have the capacity to pull real-time data from a variety of sources?
- Is it customizable to meet your priorities? Will you be able to easily add it to your business’s tech stack?
Here are some key components to include in your pipeline dashboards:
- Pipeline Stages: Visual representation of each stage.
- Total Pipeline Value: Sum of all deals currently in the pipeline.
- Deal Velocity: Average time deals spend in each stage.
- Conversion Rates: Percentage of deals that move from one stage to the next.
- Sales Forecast: Predicted revenue based on the current pipeline.
- Lead Sources: Breakdown of leads by their sources.
- Top Deals: List of the largest or most strategic deals in the pipeline.
- Sales Activities: Number of activities performed by the team.
- Team Performance: Individual and team performance metrics.
Tip: Looking for tools to help you do so? Grab our ebook below.
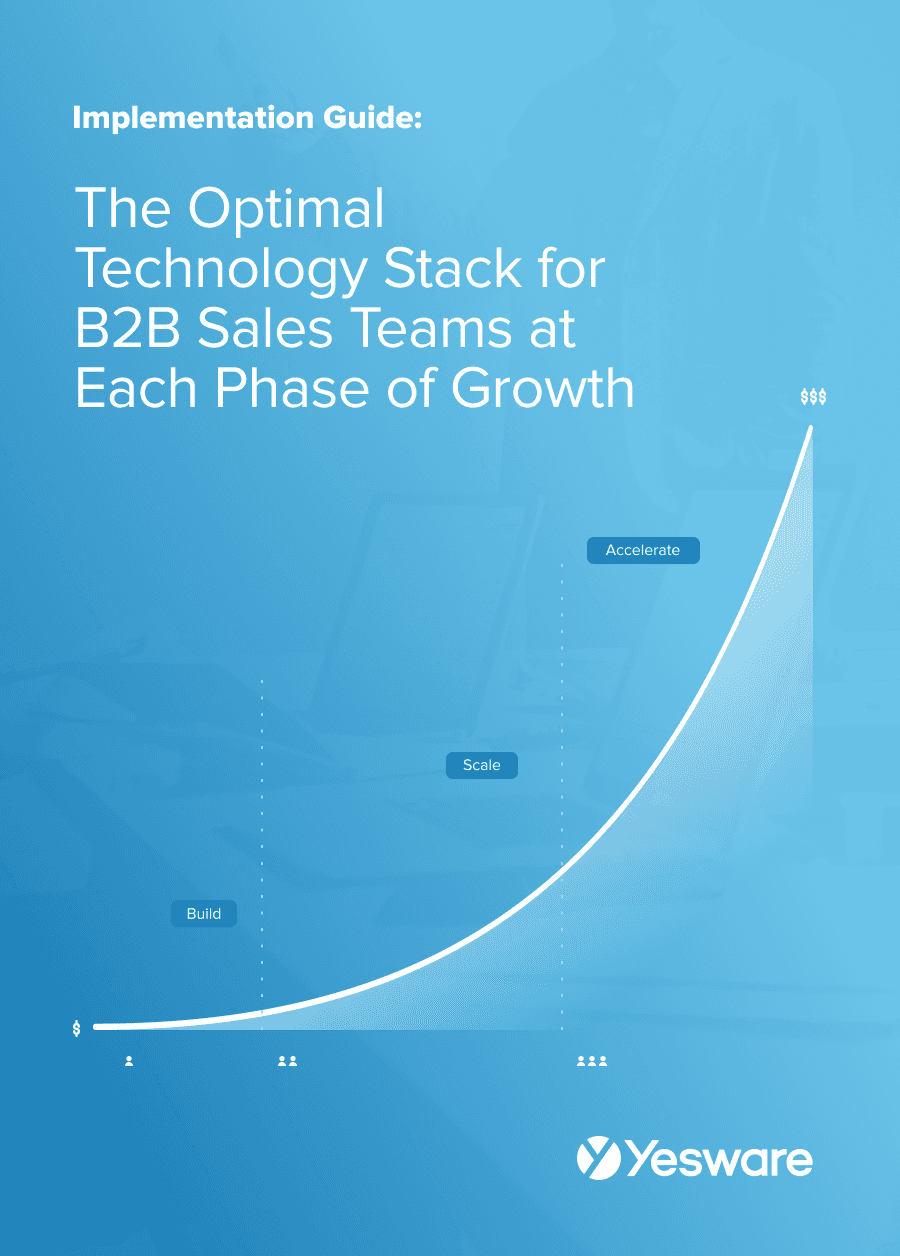 The Optimal Technology Stack for B2B Sales TeamsUsing data from the most successful business-scaling models, we designed a blueprint for the exact technology your business needs at each phase of growth.
Best Practices for Utilizing Your Sales Pipeline Dashboard
You should conduct regular pipeline reviews to maintain an accurate and efficient sales pipeline. These reviews should involve analyzing the dashboard to assess the current state of the pipeline, identify any potential issues, and make necessary adjustments.
Also, don’t forget to leverage the insights provided by your sales pipeline dashboard to make data-driven decisions. According to HBR, the key reason why sales CRM integration projects fail is that sales teams don’t make sufficient use of the data to improve the sales process.
Fostering team collaboration and transparency is another important tip for leveraging the full potential of your sales pipeline dashboard. Ensure that all team members have access to the dashboard and understand how to use it effectively.
Leveraging Technology to Enhance Your Sales Pipeline Dashboard
Technology empowers your sales strategy, saves you time, and streamlines processes. Let’s take a look.
Leveraging technology like Yesware can enhance your sales pipeline dashboard by giving you full visibility into your team’s performance.
Yesware’s email tracking tracks email opens, link clicks, and attachment views. This data can be integrated into your sales pipeline dashboard, giving you insights into the effectiveness of your email campaigns and the engagement level of your prospects.

Yesware also provides analytics on individual and team performance. These metrics can be displayed on your sales pipeline dashboard to monitor productivity and identify high-performing sales tactics.
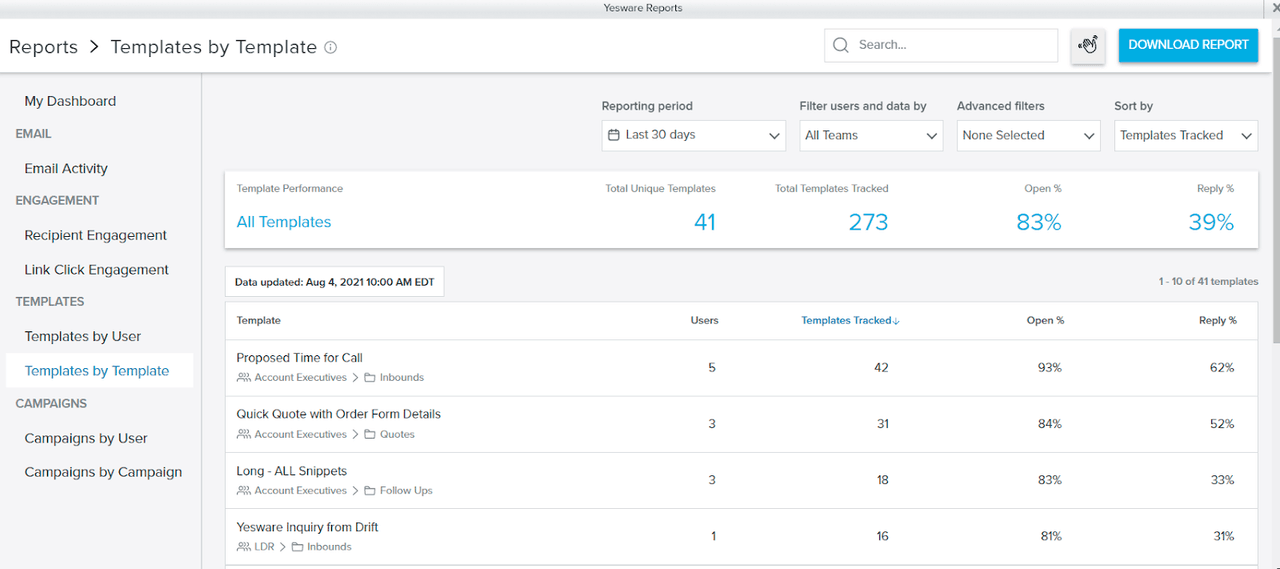
Yesware breaks down all of your engagement in Reporting & Analytics, including templates, campaigns, email activity, recipient engagement, and more.
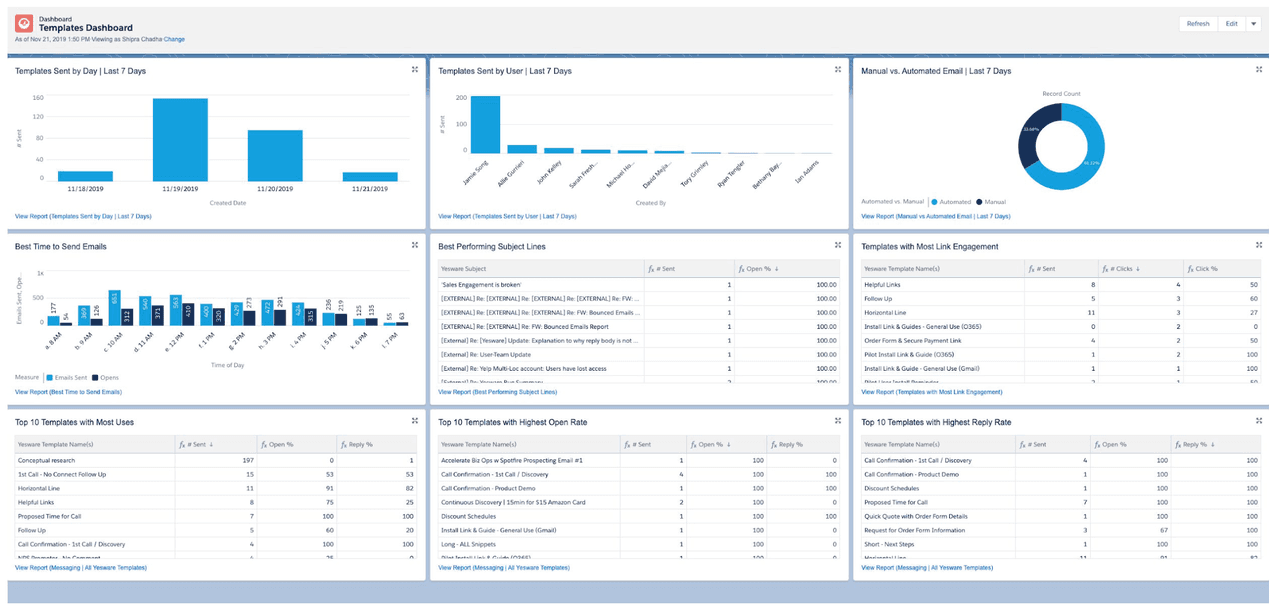
You can also instantly visualize what’s working across your team with Yesware + Salesforce dashboards. This takes the data above and creates easy-to-understand charts and graphics for you and your team.
Another valuable tool for your sales pipeline dashboard is Vendasta.
Vendasta’s Sales CRM software streamlines your team’s pipeline and aligns tasks, helps you find and nurture leads with intent and move them through the funnel faster, prioritizes the right opportunities at the right time, and accelerates your company growth.
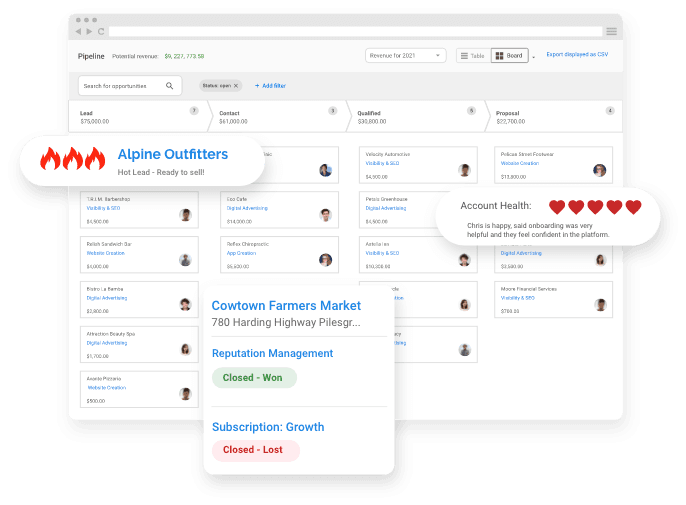
The CRM’s lead scoring system prioritizes leads based on engagement levels and potential value. It then creates a visual representation of the sales pipeline to help businesses track the progress of each lead through different stages, from initial contact to closing the deal.
Common Challenges and Solutions in Sales Pipeline Dashboard Implementation
Data Accuracy and Consistency
One of the most significant challenges in implementing a sales pipeline dashboard is ensuring data accuracy and consistency. To tackle this, you should train your team on maintaining data integrity and regularly audit your data to identify and correct discrepancies.
Tools like Yesware, which automatically captures email engagement data and synchronizes with your CRM, can significantly reduce manual data entry errors.
User Adoption and Training
Even the most sophisticated sales pipeline dashboard will only deliver value if your team adopts it.
To promote user adoption, involve your sales team in the dashboard selection and design process to ensure it meets their needs. Provide comprehensive training sessions and create easy-to-follow user guides.
Aligning Dashboard Metrics with Business Goals
A common pitfall in dashboard implementation is the misalignment of tracked metrics with the organization’s business goals. This can result in focusing on vanity metrics that do not contribute to strategic objectives.
Start by defining your business goals and identifying the KPIs that align with these goals. Regularly review and update your dashboard to ensure it continues to reflect your evolving business priorities.
Now that you know how to build an effective sales pipeline dashboard and make the most of your sales pipeline data, best of luck with boosting your business’s revenue!
Get sales tips and strategies delivered straight to your inbox.
Yesware will help you generate more sales right from your inbox. Try our Outlook add-on or Gmail Chrome extension for free, forever!
Related Articles


Casey O'Connor
![Sales Velocity: What It Is + How to Calculate It [Examples]](/blog/_next/image/?url=https%3A%2F%2Fwww.yesware.com%2Fwp-content%2Fuploads%2F2022%2F03%2Fsales-velocity-yesware.jpg&w=1280&q=75)
Casey O'Connor

Casey O'Connor
Sales, deal management, and communication tips for your inbox