34 Sales Metrics High-Performing Sales Teams Are Tracking


Anya Vitko
Contents
- What Are Sales Metrics?
- Sales Metrics vs. Sales KPIs
- Why Tracking Sales Metrics Is Important for Sales and Marketing
- Important Sales Metrics to Track
- Sales Activity Metrics
- Sales Performance Metrics
- Customer Satisfaction Metrics
- Sales Tracking Tools
- Frequently Asked Questions (FAQ)
- Conclusion: Start Tracking What Actually Moves the Needle
There’s nothing but truth to the old saying, “What gets measured gets managed.”
Keeping track of sales metrics and overall sales performance has never been more important than it is today. The rise of digital sales tools has afforded salespeople virtually unlimited access to just about any data they seek.
In fact, there’s so much data available that many sales teams struggle to know which sales metrics to track, and how to use them to drive performance.
In this article, we’ll go over everything you need to know about sales metrics, including why they’re so important, which to track (no matter what type of business you run), and tools you can use to help the process.
Here’s what we’ll cover:
- What Are Sales Metrics?
- Sales Metrics vs. Sales KPIs
- Why Tracking Sales Metrics Is Important for Sales and Marketing
- Important Sales Metrics to Track
- Sales Activity Metrics
- Sales Performance Metrics
- Customer Satisfaction Metrics
- Sales Tracking Tools
- Frequently Asked Questions (FAQ)
What Are Sales Metrics?
Sales metrics are quantifiable indicators that track how well your sales activities are performing. These data points help measure the effectiveness of individual sales reps, teams, or the entire sales organization across a defined time frame.
From tracking sales velocity to measuring deal win rates, sales metrics offer critical visibility into each stage of the sales process. By translating activity into insights, they show you what’s working, what’s lagging, and where to focus your efforts.
Modern sales teams rely on these metrics to:
- Track progress toward sales goals and quotas.
- Build accurate forecasts that support strategic growth planning.
- Uncover bottlenecks or inefficiencies in the sales funnel.
- Align compensation plans, commissions, and performance incentives with actual outcomes.
- Support data-driven decision-making across tools, training, and territory planning.
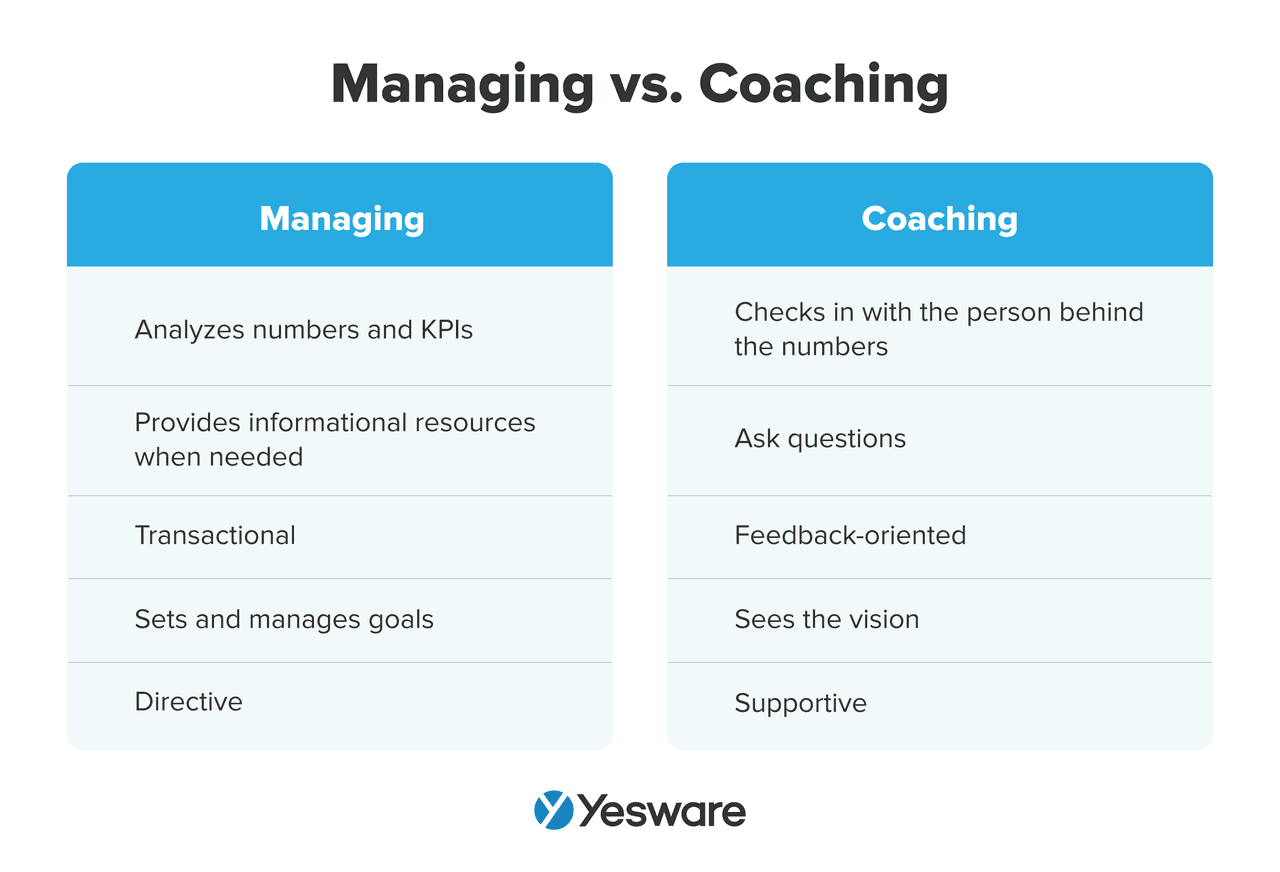
In short, sales metrics are the foundation of performance management. When tracked consistently and interpreted correctly, they empower your team to refine sales tactics, scale smartly, and drive predictable revenue. Strong sales leadership ensures these metrics are used effectively to guide strategy, coaching, and team development.
Sales Metrics vs. Sales KPIs
Translating sales metrics into KPIs (Key Performance Indicators) is about turning raw activity and performance data into focused benchmarks that align with your business goals.
Sales KPIs, on the other hand, are the high-priority metrics that align most directly with your strategic objectives. They’re the key indicators of whether your team is on track to meet its business goals, such as hitting quarterly revenue targets, improving customer retention, or shortening the sales cycle.
Think of it this way:
- All KPIs are sales metrics, but not all sales metrics are KPIs.
- KPIs are the metrics that matter most for measuring success and guiding executive-level decisions.
For example:
- Sales metric: Number of discovery calls completed.
- Sales KPI: Conversion rate from discovery call to closed deal.
By clearly defining your KPIs and tracking them alongside other supporting metrics, your sales team can focus on what truly moves the needle, turning data into action and goals into results.
Why Tracking Sales Metrics Is Important for Sales and Marketing
Tracking sales metrics isn’t just about monitoring rep performance—it’s a bridge between sales and marketing. These metrics provide both departments with shared insight into what’s working, what’s not, and where to optimize for better results.
At the heart of this collaboration lies a key distinction: leading indicators vs. lagging indicators.
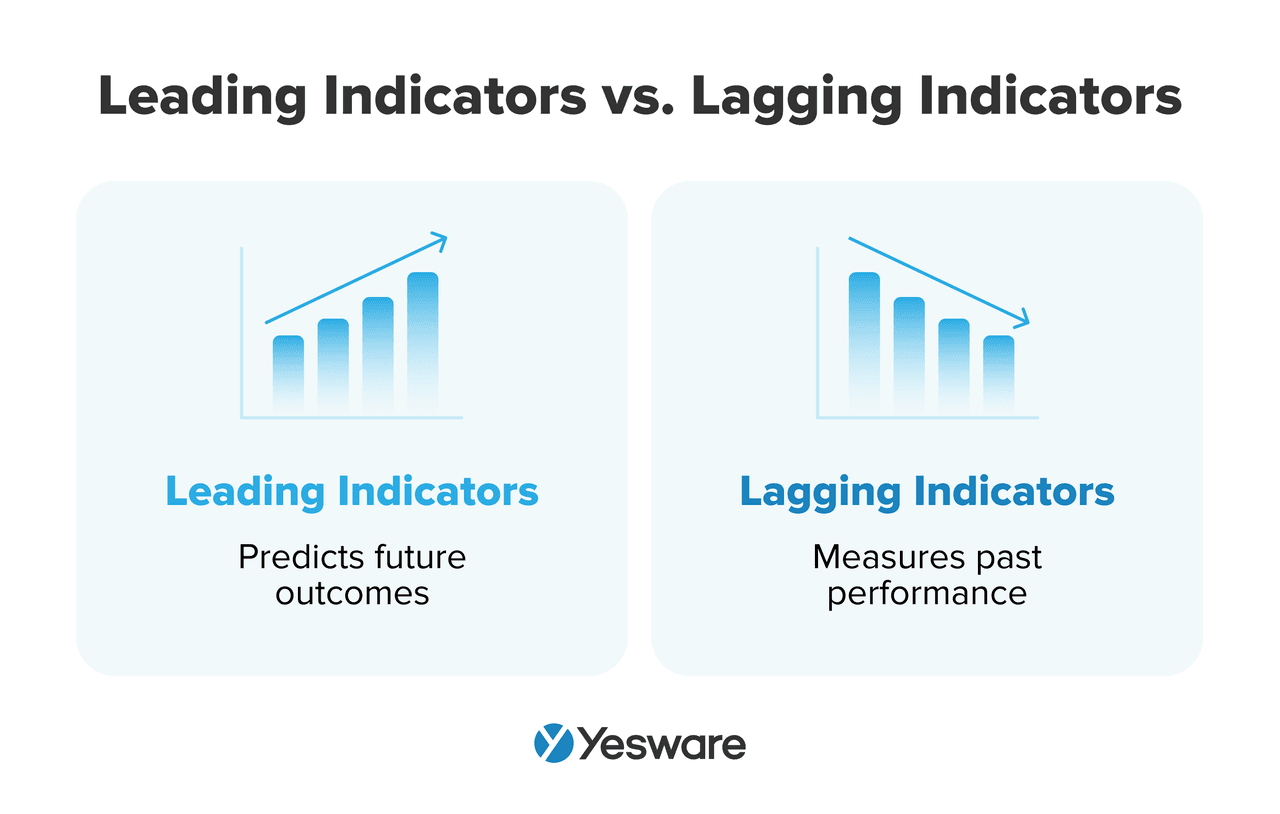
- Leading indicators are predictive. They signal future outcomes and help teams adjust strategies in real time. Examples include email open rates, demo bookings, and first-touch engagement. These are typically influenced by marketing campaigns or early sales outreach.
- Lagging indicators reflect outcomes that have already happened. These include metrics like closed-won deals, revenue generated, or sales cycle length. They’re backward-looking but essential for evaluating the effectiveness of prior activities.
Sales metrics often serve as lagging indicators for marketing efforts. For instance, if a new campaign launches and results in an uptick in MQLs (Marketing Qualified Leads), the impact on actual sales, such as win rate or revenue per lead, may take weeks or months to surface. Those lagging sales metrics ultimately reveal whether the campaign achieved its intended business goals.
By analyzing both types of indicators together:
- Marketers can determine which content, channels, or campaigns produce the highest-quality leads.
- Sales teams can identify which lead sources are worth prioritizing and tailor their approach accordingly.
This data ensures marketing and sales alignment to drive the following outcomes:
- Build a more predictable, scalable revenue engine.
- Reverse-engineer what’s driving success and replicate it.
- Align activities and goals through a shared, data-driven lens.
In short, tracking sales metrics gives both departments the full picture, from early buyer behavior to final conversion, helping them make smarter, faster, and more coordinated decisions.
Important Sales Metrics to Track
High-performing sales teams track a strategic mix of metrics across three key categories: Sales Activity, Sales Performance, and Customer Satisfaction. These metrics offer a comprehensive view of your pipeline health, sales execution, and customer outcomes, helping you make data-backed decisions at every stage of the sales funnel.
Sales Activity Metrics
Sales activity metrics are leading indicators that measure the inputs of your sales process. By tracking these, you can gauge the effort invested in building your pipeline and identify areas for improvement.
Key Metrics to Monitor
- Number of Calls Made: Keep track of your outbound call volume to ensure consistent prospecting efforts.
- Emails Sent: Monitor the number of outreach emails you send to assess your communication activity levels.
- Meetings Booked: Evaluate how effectively you’re converting outreach into scheduled conversations.
- LinkedIn Connections or Messages: Measure your engagement on social platforms, which is increasingly important in B2B sales.
- Touchpoints per Lead: Determine the average number of follow-ups needed to engage a prospect.
- Time Spent Selling: Assess the percentage of your time dedicated to revenue-generating tasks versus administrative work.
- Follow-Up Rate: Ensure you’re consistently following up after initial outreach—a key factor in increasing conversion rates.
Example: If you typically average 4 touchpoints per lead and book 8 meetings per week, consider adopting a new cadence. Increasing to 6 touchpoints might lead to booking 12 meetings weekly, highlighting the importance of persistence.
Sales Activity Effectiveness Metrics
This group of metrics helps you understand how effective your sales outreach is. They turn raw activity into insights, showing whether your messaging, timing, and targeting are actually engaging your prospects.
8. Email Open Rate
The percentage of sent emails that are opened by recipients.
Here’s the formula to calculate email open rate:
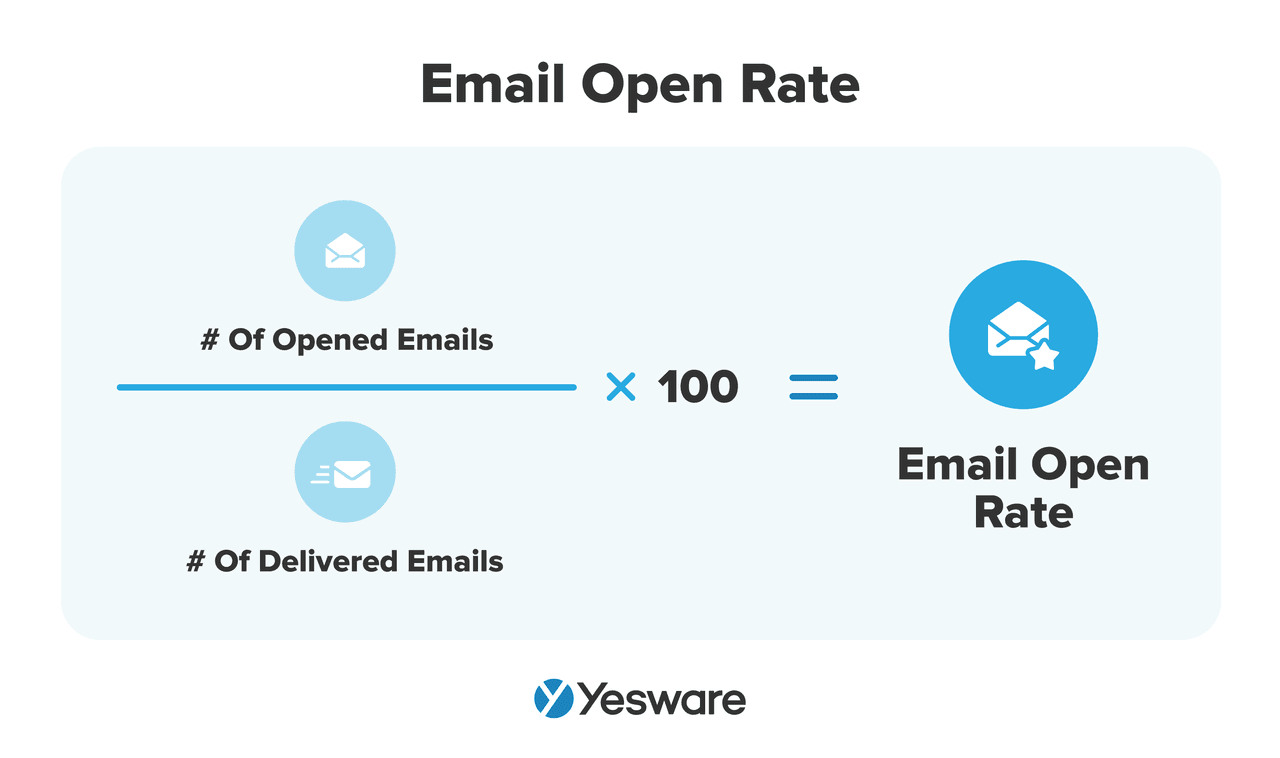
Why it Matters: A low open rate suggests that subject lines or sender credibility need improvement. A high open rate indicates strong initial engagement and relevance.
9. Click-Through Rate (CTR)
The percentage of recipients who clicked a link in your email.
Formula: CTR (%) = (Clicks / Emails Delivered) × 100
Why it Matters: CTR reflects the value and clarity of your email content and call-to-action. It’s a signal of deeper interest beyond the subject line.
10. Reply Rate
The percentage of emails that generate a response.
Here’s the formula to calculate email response rate:
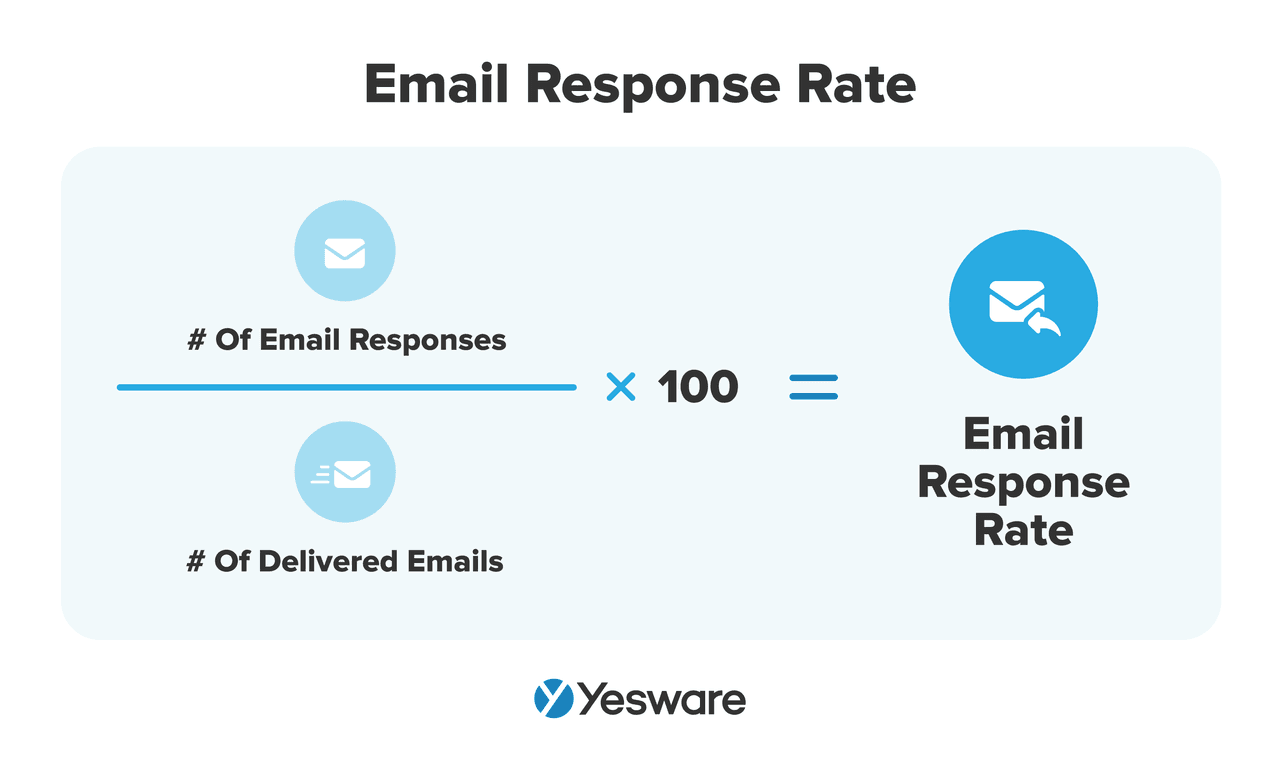
Why it Matters: This is a key indicator of whether your message resonates and moves the conversation forward. It often correlates with meetings booked and opportunity creation.
11. Meeting Conversion Rate
The percentage of conversations or replies that result in a booked meeting.
Formula: Meeting Conversion Rate (%) = (Meetings Booked / Replies) × 100
Why it Matters: This shows how well you’re turning engaged prospects into live conversations—a critical step toward pipeline growth.
12. Call Connection Rate
The percentage of calls that result in a live conversation with a prospect.
Formula: Connection Rate (%) = (Connected Calls / Total Calls Made) × 100
Why it Matters: It reveals the effectiveness of your call timing, contact list quality, and voicemail strategy.
13. Follow-Up Response Rate
The percentage of follow-up messages that receive a reply.
Formula: Follow-Up Response Rate (%) = (Follow-Up Replies / Follow-Up Emails Sent) × 100
Why it Matters: Since most sales require multiple touchpoints, this metric tells you how well your later-stage messaging performs—and whether you’re creating value beyond the first contact.
Pro Tip: For guidance on choosing the right tool for your email metrics, check out The 10 Best Free Sales Tracking Software in 2025.
How You Can Use Yesware to Track These Metrics
Yesware is a sales engagement and enablement platform that helps you monitor and improve your sales activities:
- Email Tracking: Receive real-time notifications when recipients open your emails or click links, allowing you to follow up at optimal times.

- Campaign Analytics: Use multi-touch campaigns to automate outreach sequences and analyze performance metrics like open rates, reply rates, and touchpoint completion.
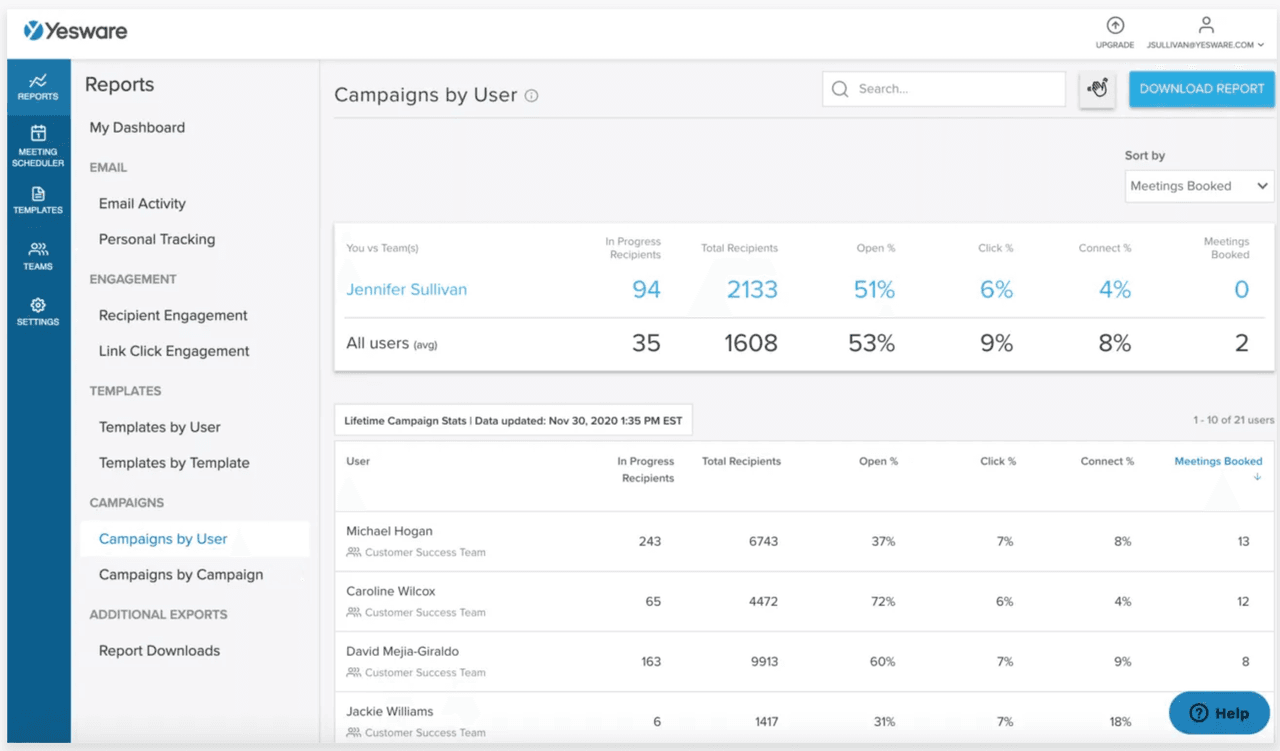
- Meeting Scheduler: Integrate your calendar to streamline the process of booking meetings, reducing back-and-forth communication.
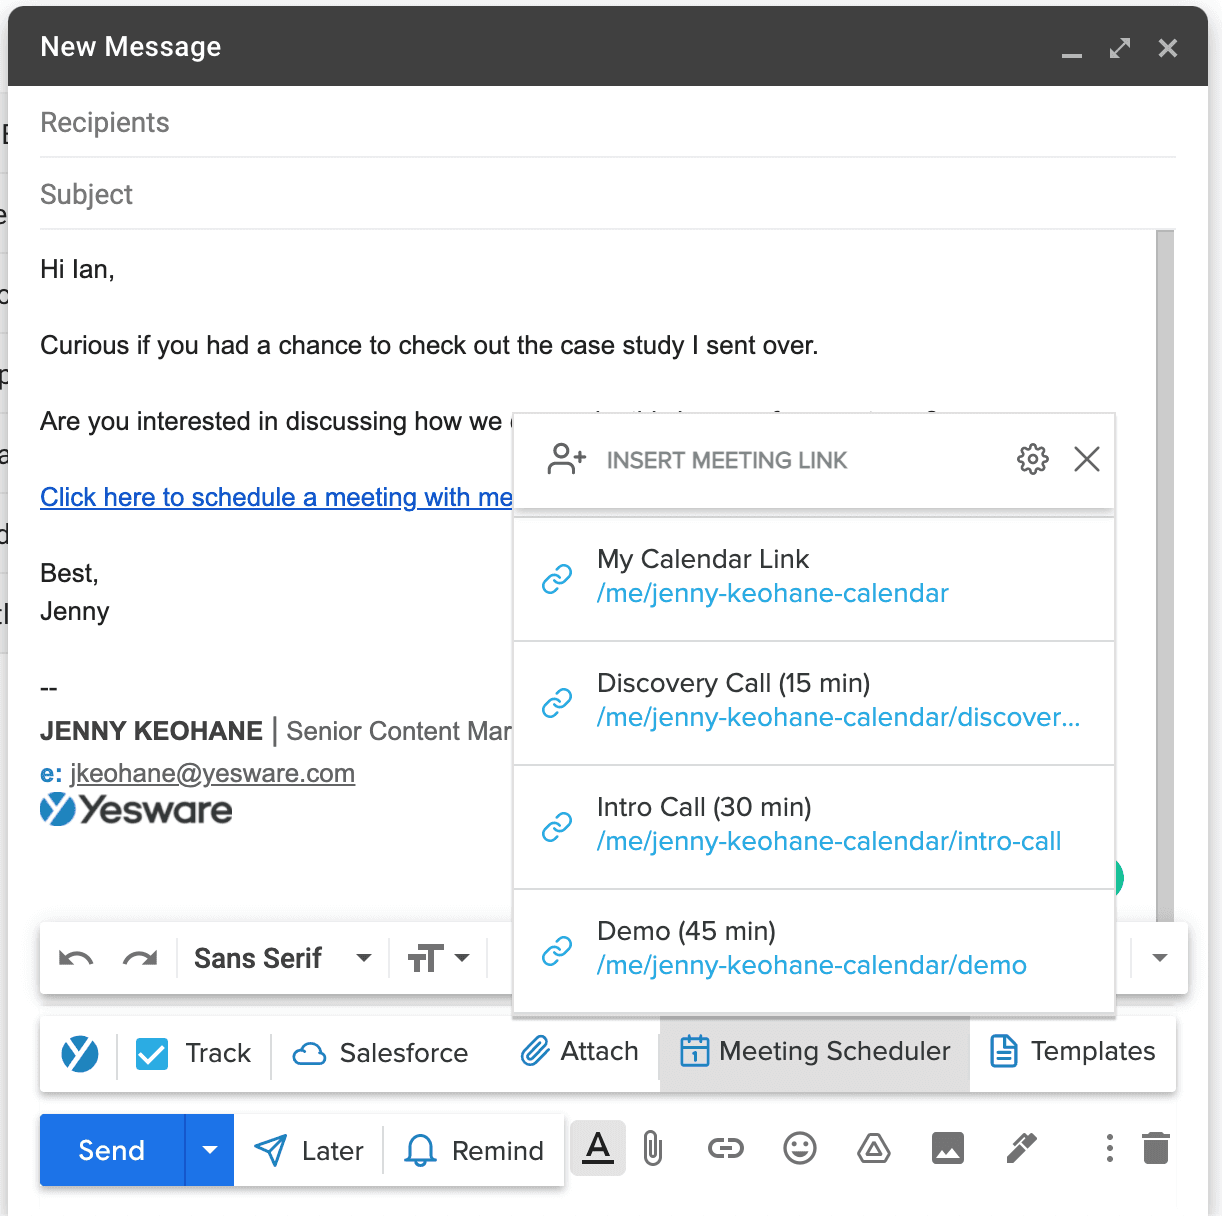
- Activity Dashboard: Access a centralized view of your emails sent, calls logged, and reply rates to gain real-time insights into your prospecting efforts.
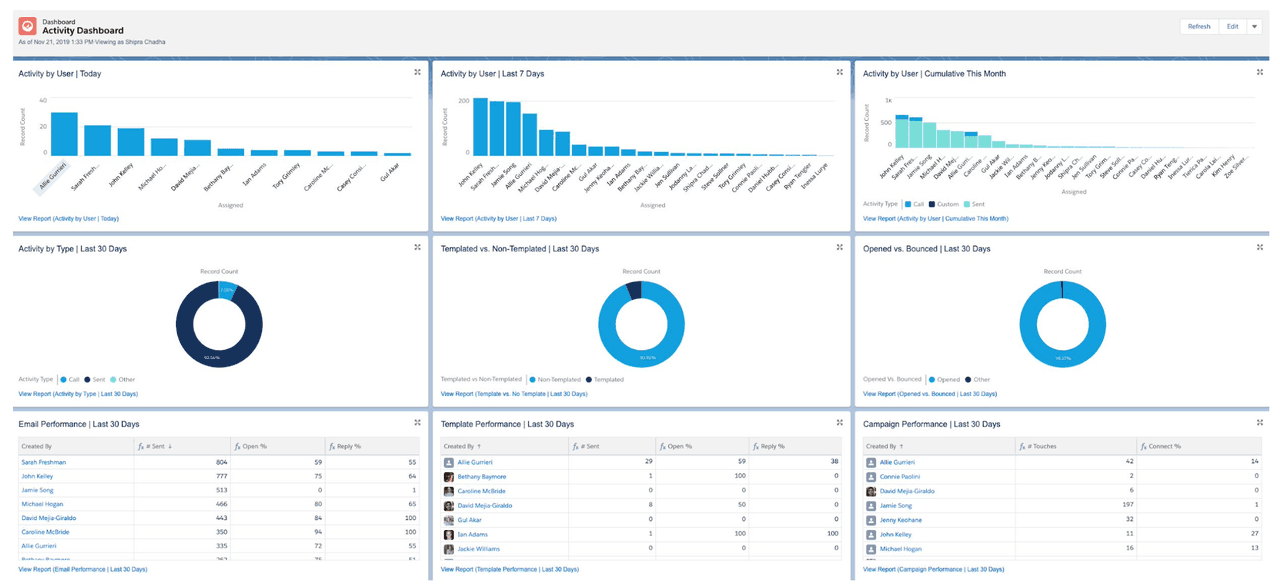
By leveraging Yesware’s tools, you can reduce administrative tasks, gain immediate feedback on your outreach efforts, and focus more on building relationships and booking meetings.
Sales Performance Metrics
Once your outreach is in motion, it’s time to focus on outcomes. Sales performance metrics help you understand how effectively you’re moving prospects through the pipeline and converting activity into revenue. These are your lagging indicators—the results of your daily efforts.
Here’s how you can use each metric to sharpen your sales strategy—and how Yesware can support you along the way:
14. Opportunity-to-Close Rate (Win Rate)
This tells you what percentage of your qualified opportunities result in closed deals.
Here’s the formula to calculate opportunity win rate:
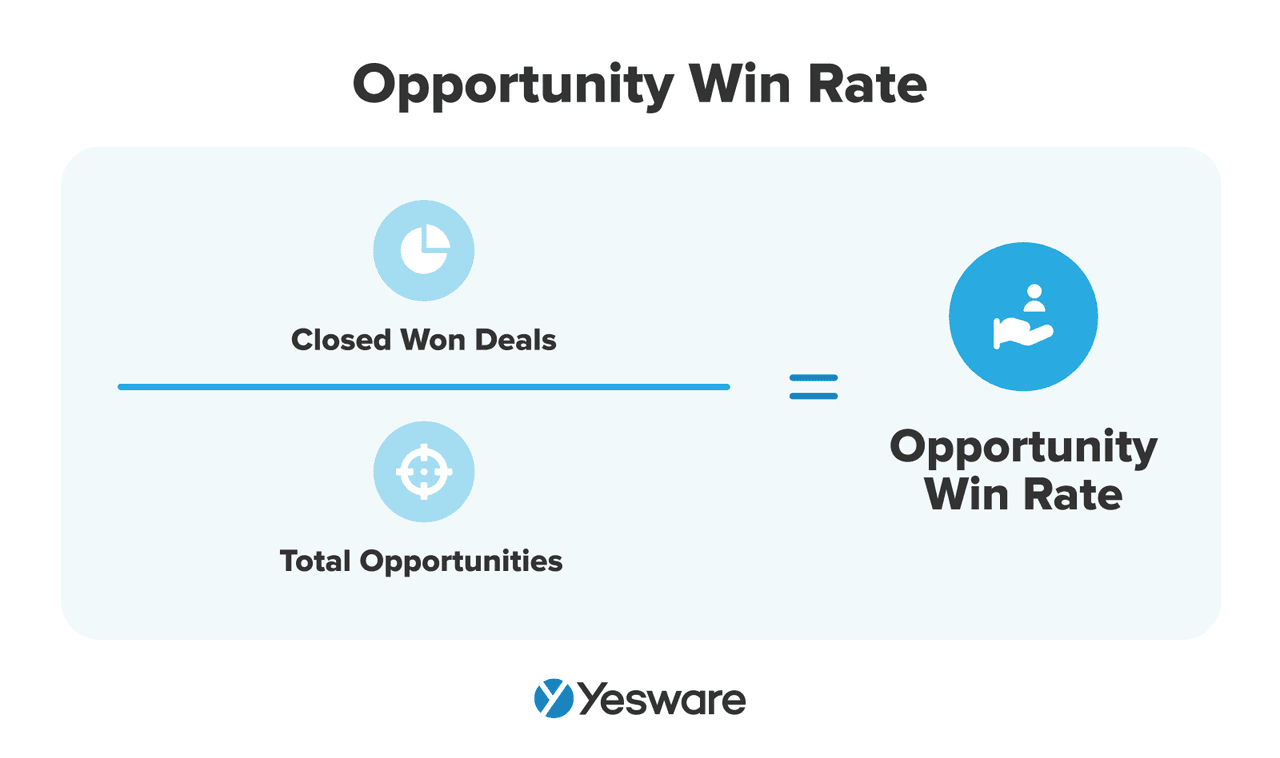
Why it matters: A low win rate can highlight misalignment between your sales pitch and your prospect’s needs or signal issues with qualification.
15. Average Deal Size
This measures the average revenue you generate per closed deal.
Here’s the formula to calculate average deal size:
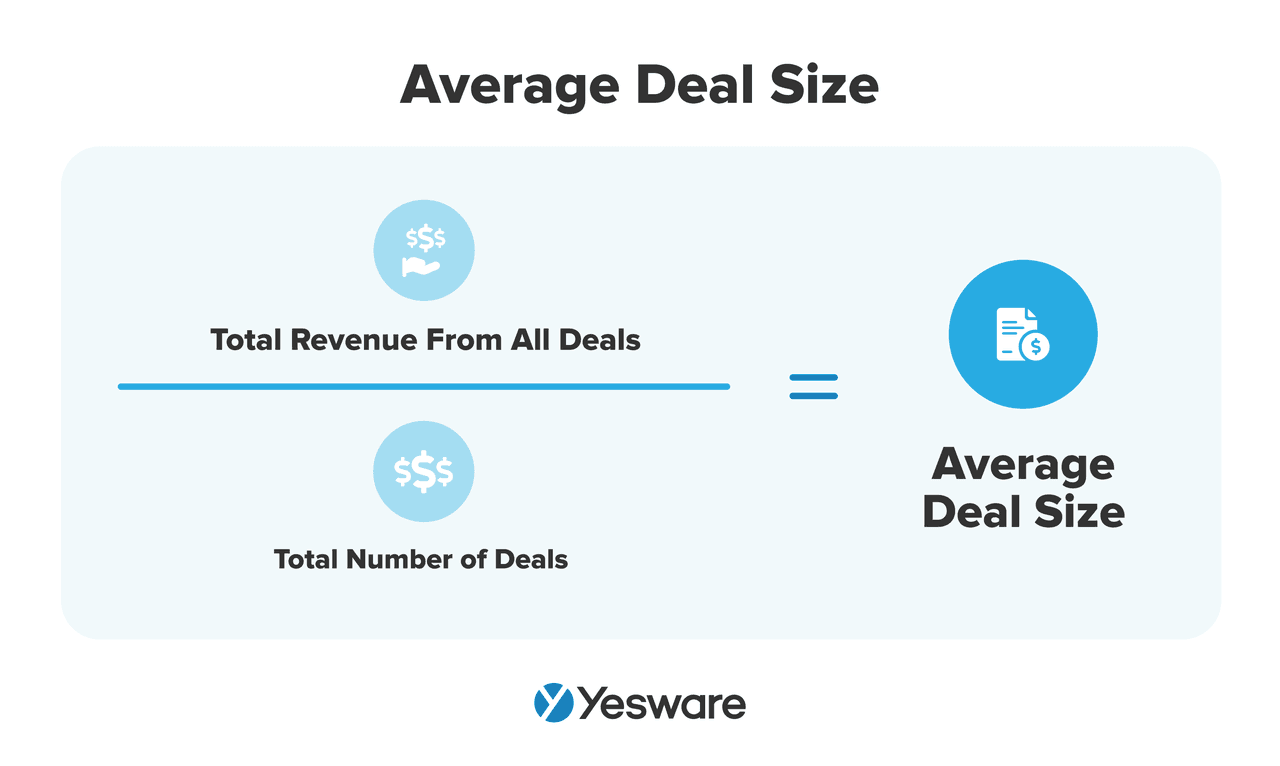
Why it matters: Tracking this helps you identify upsell opportunities or spot discounting trends.
The higher the average deal size, the more likely it is that your team is closing higher-value deals; this can lead to higher confidence in aggressive sales forecasts.
16. Sales Cycle Length
This metric shows the average number of days it takes you to close a deal, from first touch to signed contract.
Here’s the formula to calculate average sales cycle length:
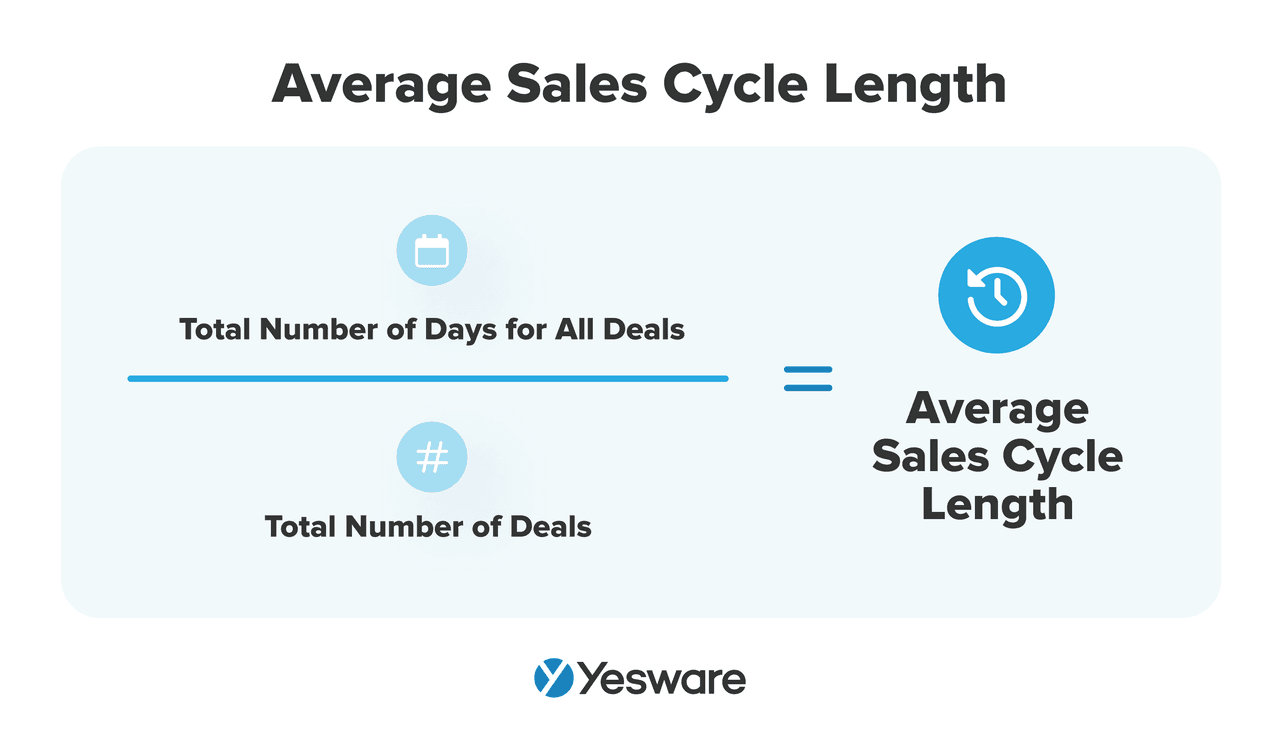
Why it matters: Although it appears at surface level that the shortest sales cycles are the most profitable ones, shorter does not always equal better.
Many sales teams that sell to enterprise companies, for example, can testify that the need for several decision-makers and consideration slows their sales process — but that’s not necessarily “bad.”
Instead of thinking about how to simply shorten the sales cycle, consider how your team can optimize it.
17. Pipeline Coverage Ratio
This compares the total value of your active opportunities to your sales target or quota.
Here’s the formula to calculate pipeline coverage:
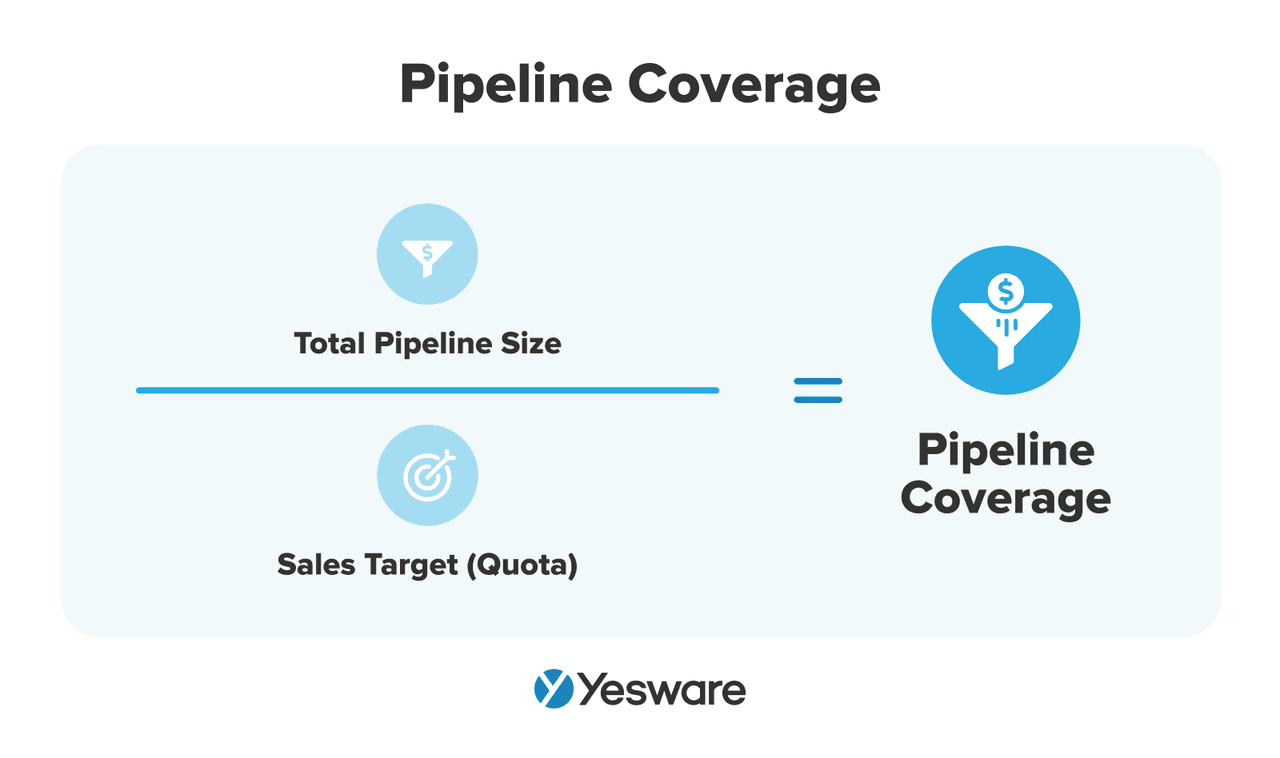
Why it matters: If your ratio is low (less than 3x), you may not have enough in play to hit your number.
18. Quota Attainment
This tells you how close you are to reaching your monthly or quarterly goals.
Here’s the formula to calculate sales quota attainment:
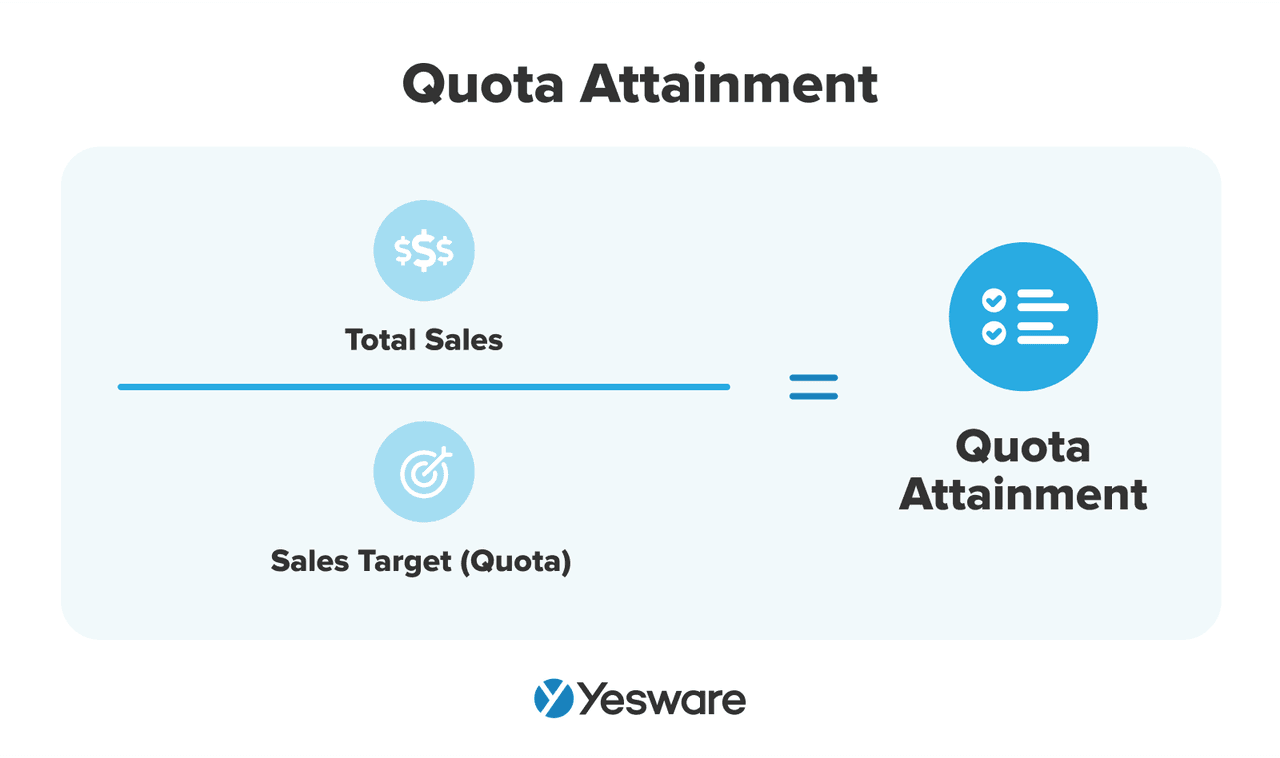
Why it matters: It’s a core measure of your performance and compensation. Quota attainment analysis helps sales managers adjust sales forecasts as needed, identify both top-performing sales reps and those that need coaching, and optimize their sales strategies.
19. Conversion Rate by Stage
This shows how many prospects move from one sales stage to the next (e.g., from discovery to demo, or demo to proposal).
Here’s the formula to calculate conversion rate by sales funnel stage:
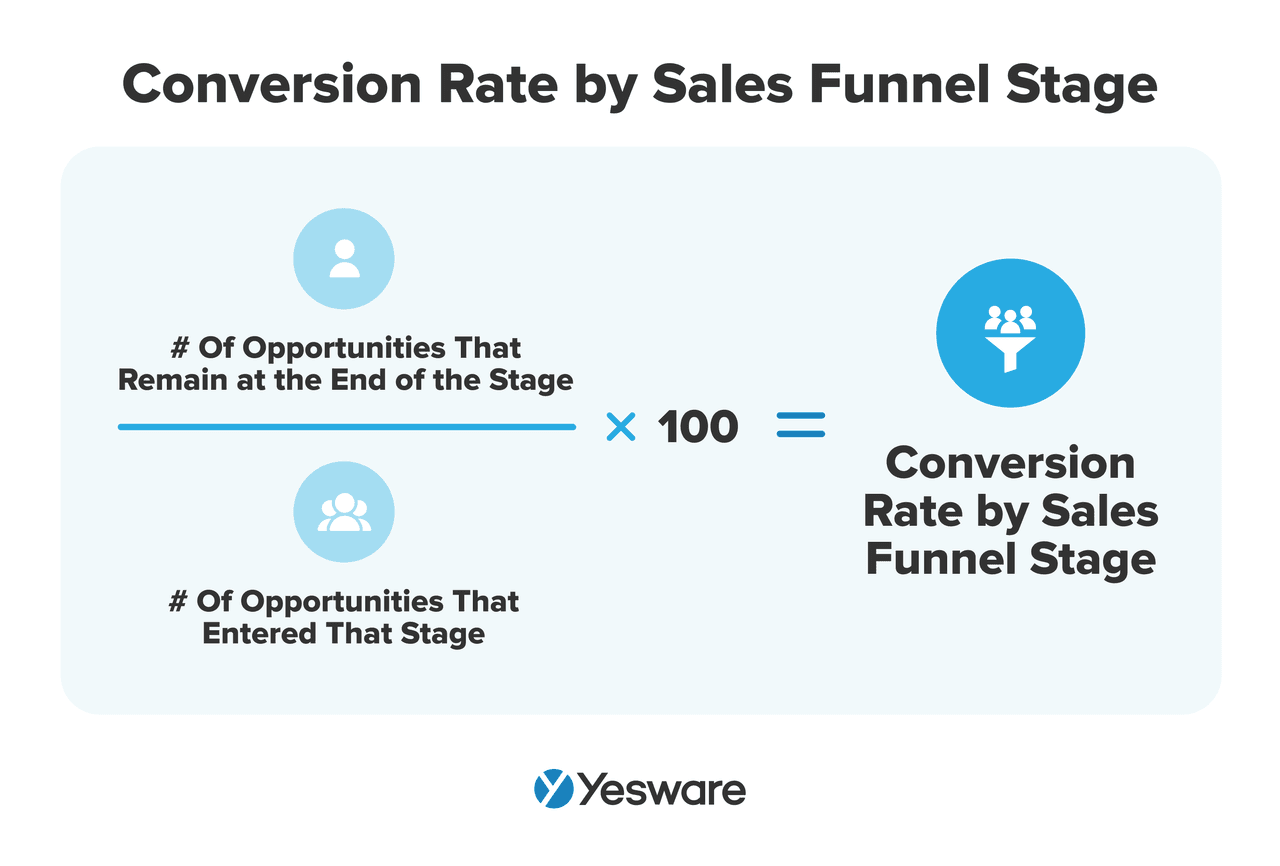
Why it matters: High drop-off at a particular stage can point to messaging, pricing, or product fit issues.
Tip: We measured various of the metrics discussed in this article with over three million sales activities to create a data trends guide. Check it out below.
 Sales Engagement Data Trends from 3+ Million Sales ActivitiesLooking at millions of tracked email activity over the past few years, this ebook is filled with our top studies and findings to help sales teams accelerate results.
20. Lead Response Time
This measures how quickly you respond to new leads.
Here’s the formula to calculate lead response time:
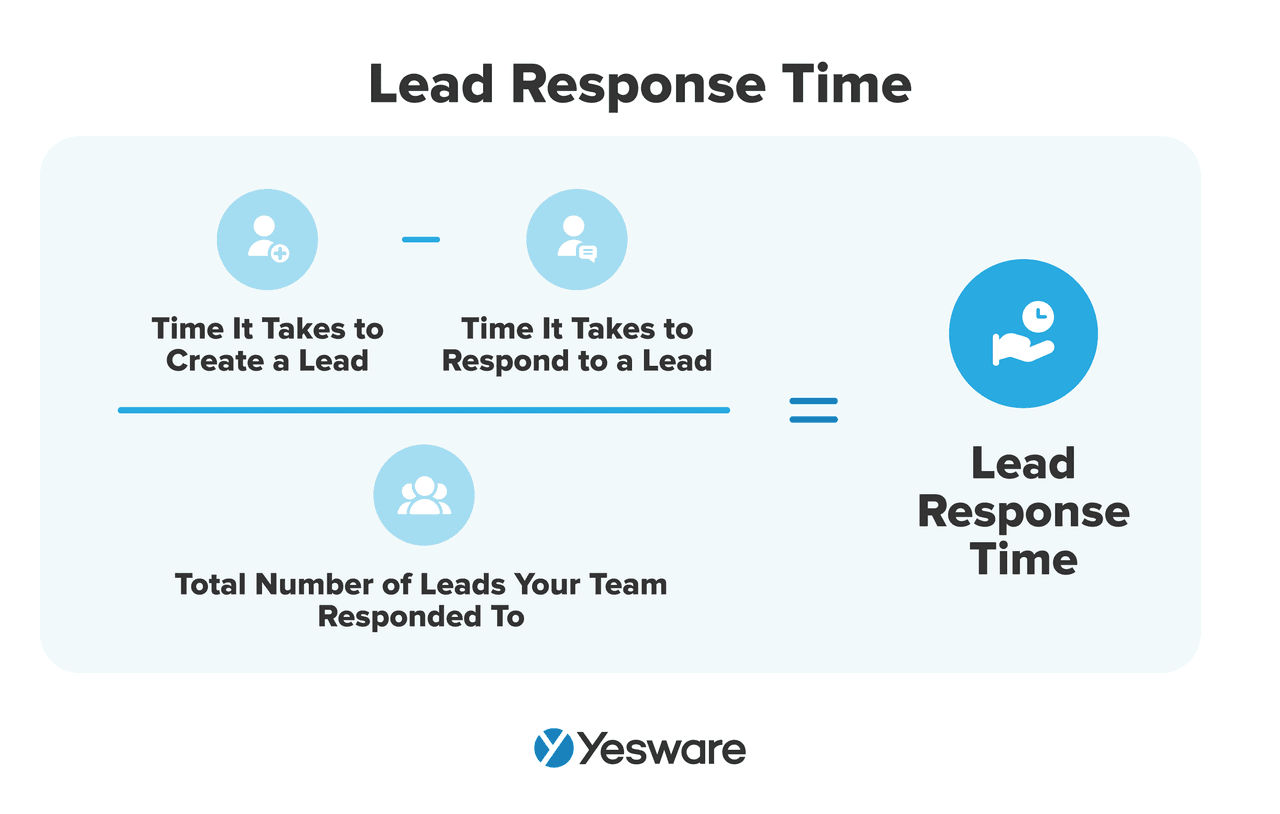
Why it matters: Lead response time is one of the most important metrics for B2B sales teams, whether they work with inbound or outbound leads.
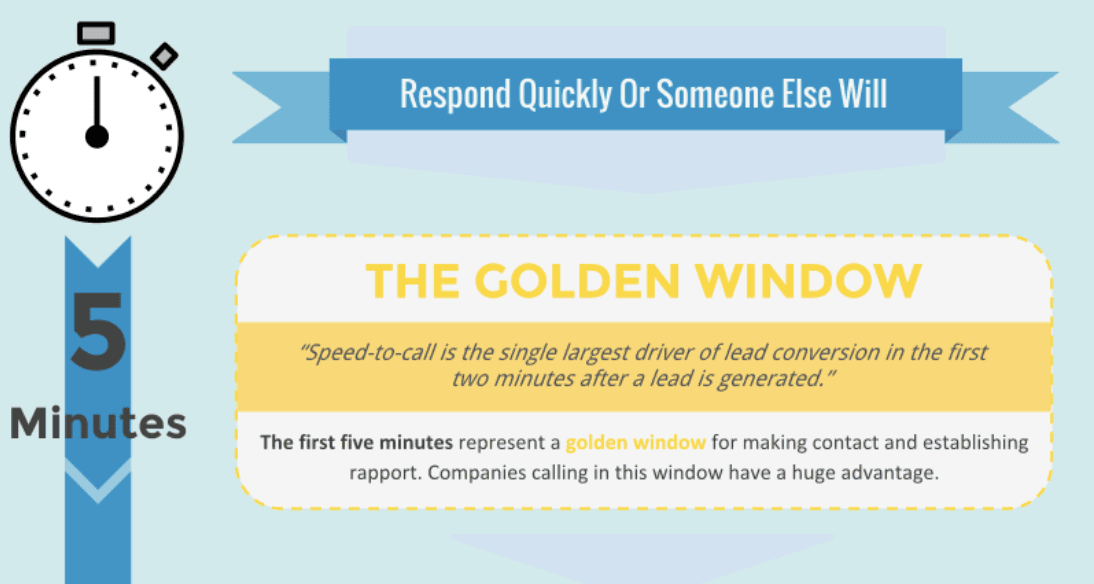
The sooner you can respond to a lead’s interest, the better. Responding within the “Golden Window” greatly improves a rep’s chances of converting a lead.
The way your team calculates lead response time will vary based on the ways in which you generate leads, and the ways in which you choose to respond.
21. Revenue
One of the most relevant sales metrics for any company to track is revenue.
Tracking revenue can provide salespeople with an incredible amount of insight into their performance. That’s partially because it speaks directly to the bottom line — which is obviously very important to monitor in order to be successful.
Here’s the formula to calculate total revenue:
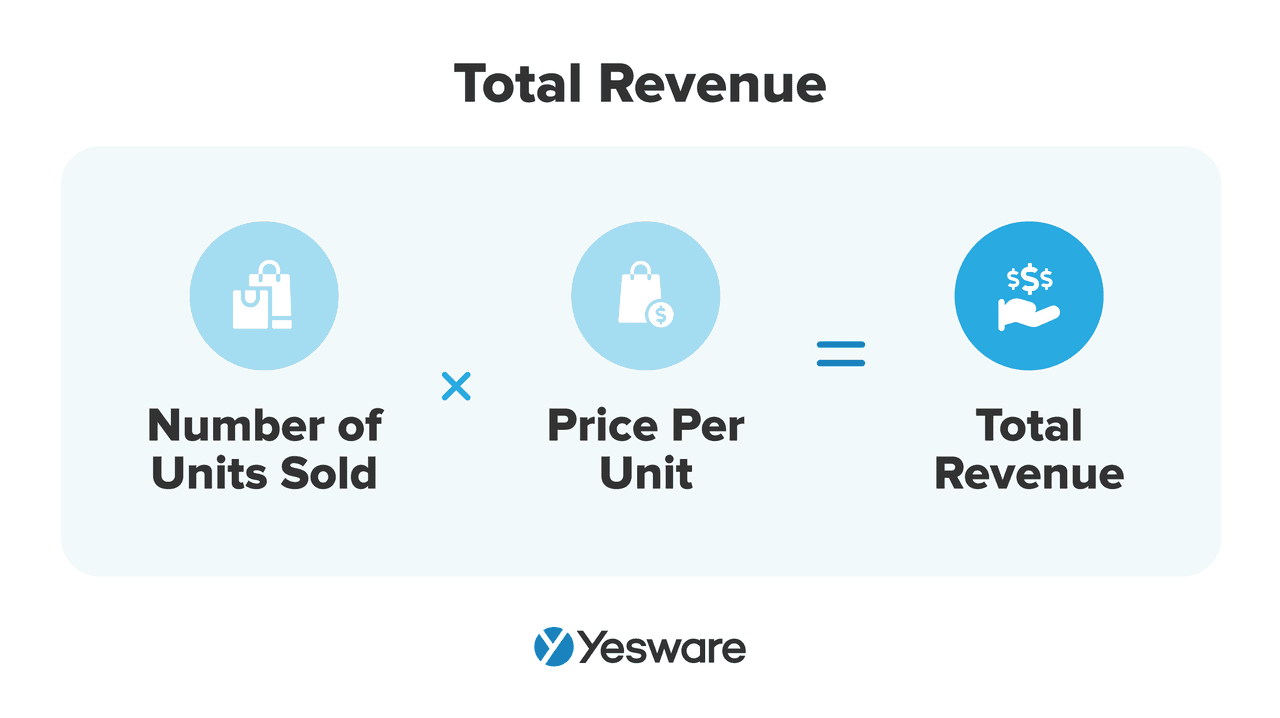
Tracking revenue is powerful for another reason: it’s an extremely flexible metric that can be measured in a variety of ways.
Teams can analyze a subset of the revenue metric, like the amount of revenue generated by individual sales reps, to determine how effectively each member of the team works.
They can also track revenue by product, revenue by territory, or average revenue per user account to determine which of their segments is most profitable.
Teams might track what percentage of revenue is generated by new business vs. existing business. SaaS teams may analyze annual recurring revenue (ARR). Tracking revenue can also help teams determine their year-over-year growth rate.
Tracking each of these sub-metrics born out of revenue helps sales and marketing teams create accurate forecasts and strategically plan for growth.
22. Average Profit Margin
Calculating average profit margin helps sales teams understand how much total revenue their organization actually pockets after accounting for expenses.
There are several ways to calculate profit margin, the three most common being gross profit margin, operating profit margin, and net profit margin.
Here are the formulas to calculate each:
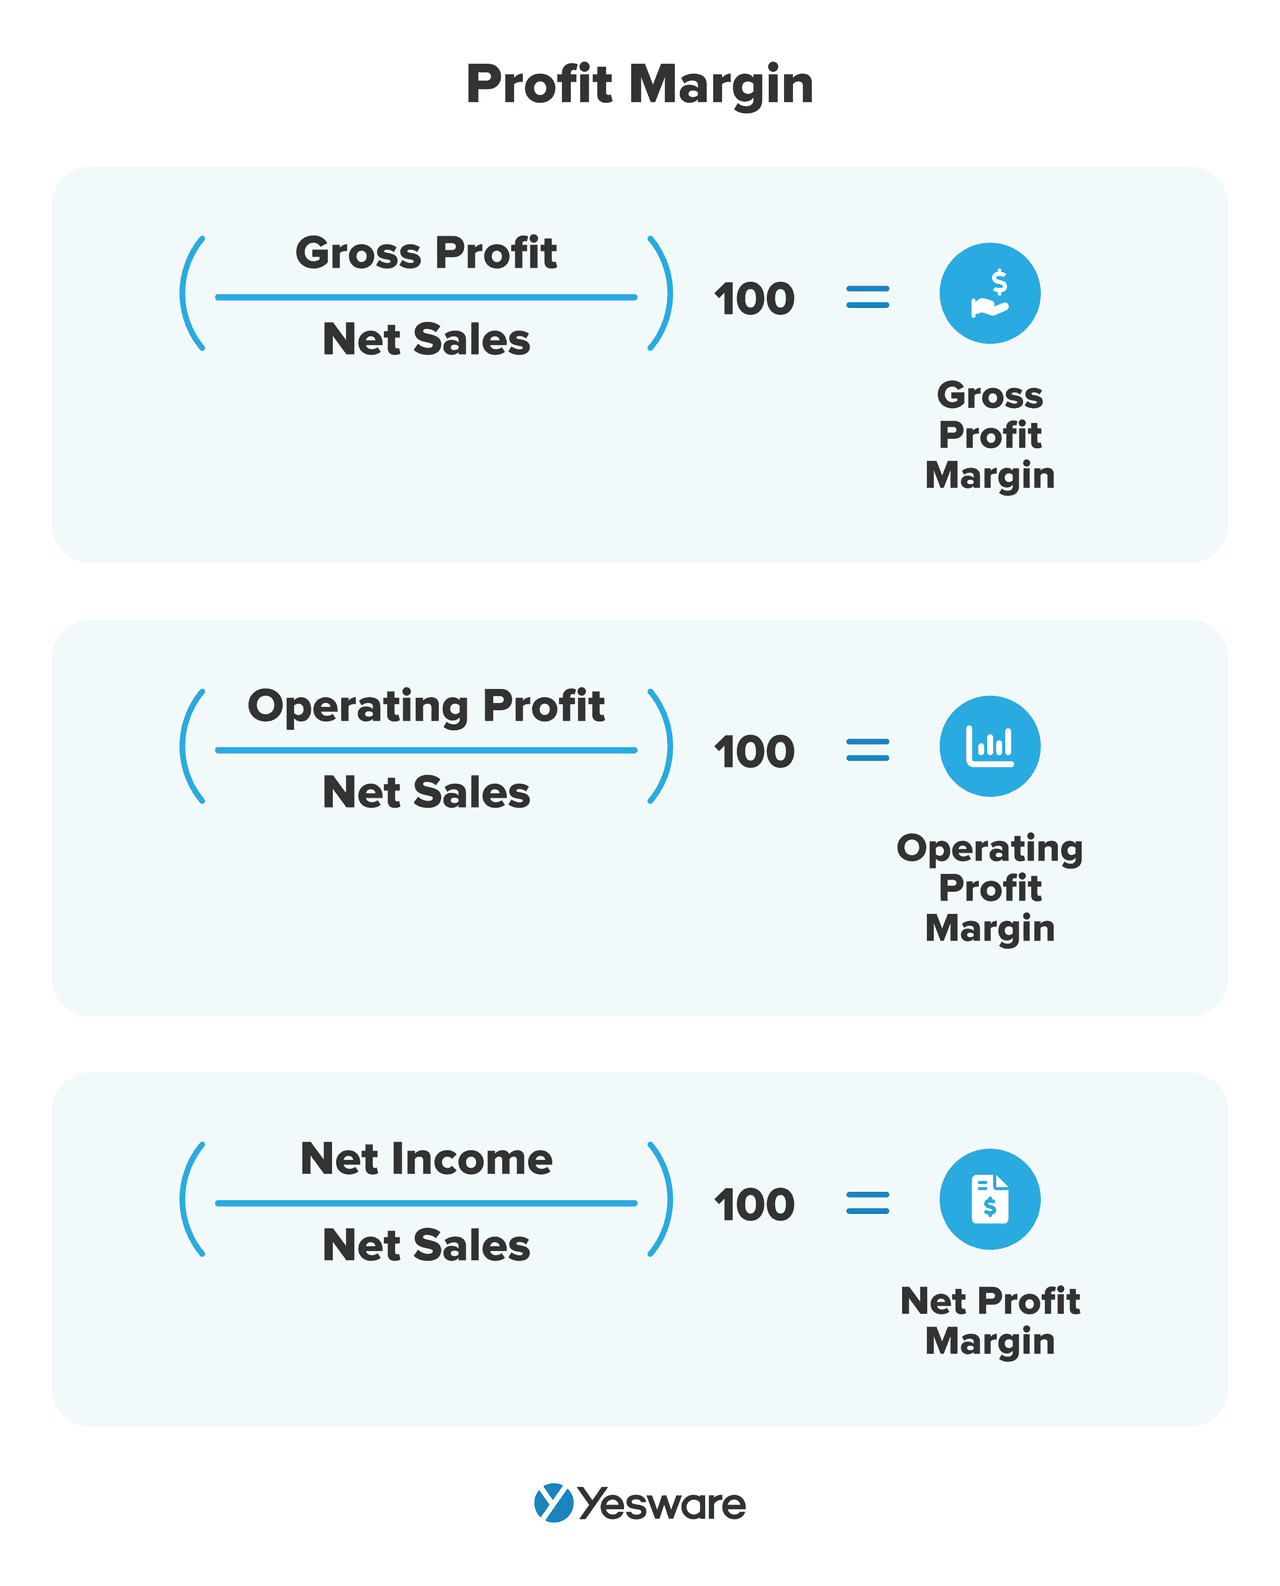
Gross profit represents the amount of money a business keeps after deducting the costs of manufacturing the product, or the cost of goods sold (COGS).
Operating profit margin is gross profit, minus operational costs.
Net profit is the final profit calculation in the chain — the amount of money a business counts as profit after deducting COGS, operational costs, and all other deductions (e.g., interest and taxes).
23. Forecast Accuracy
This tracks how close your predictions are to your actual results.
Here’s the formula:
Forecast Accuracy (%) = [1 – (|Forecast – Actual| / Actual)] × 100
Why it matters: Consistent accuracy builds trust with leadership and helps the business make better decisions.
Poor forecast accuracy, on the other hand, signals issues like:
- Inconsistent qualification criteria.
- Overly optimistic or pessimistic deal assessments.
- Pipeline bloat or stagnant deals being counted toward revenue.
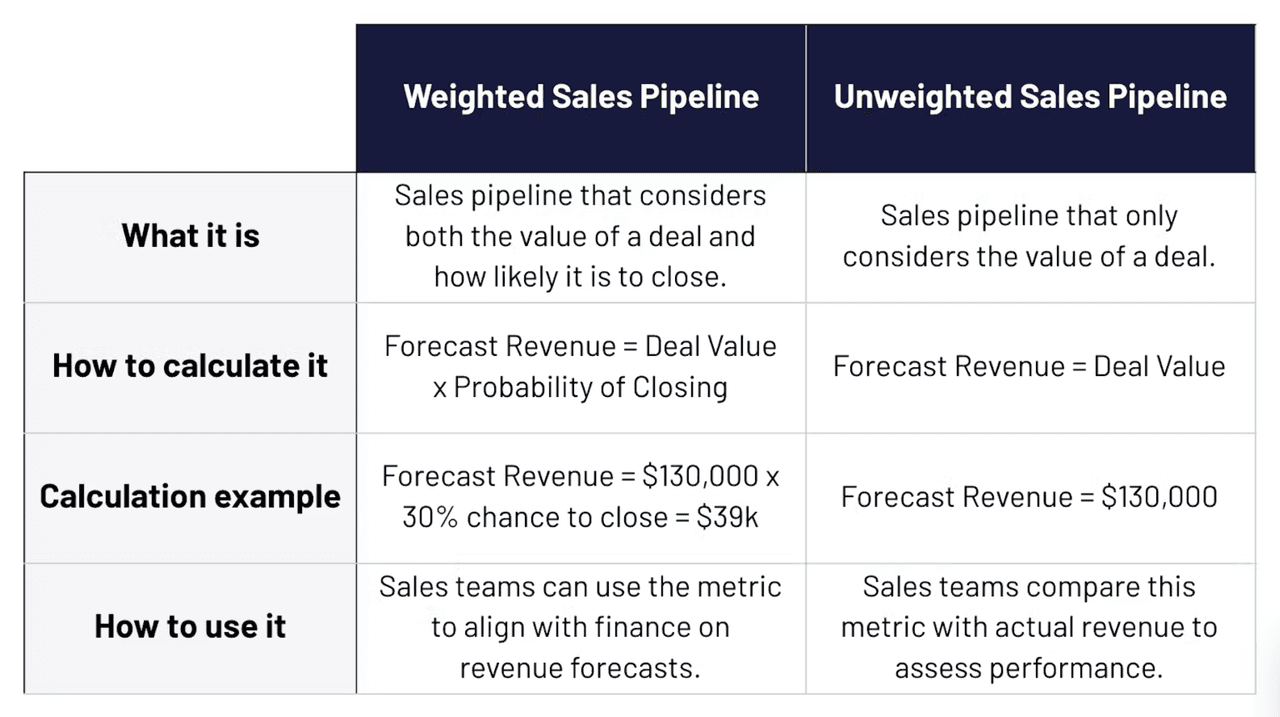
24. Weighted Value of Pipeline
This metric adds realism to your sales forecasts by accounting for the probability of each deal closing. Instead of treating all pipeline deals as if they will close (which inflates projections), this method adjusts each deal’s value based on its stage in the sales funnel.
Each stage of your pipeline should have a predefined probability (based on historical conversion data). For example:
- Discovery = 20%
- Demo Completed = 40%
- Proposal Sent = 70%
- Verbal Agreement = 90%
Example:
You have three deals in your pipeline:
- $10,000 in Discovery (20%) → $2,000 weighted
- $15,000 in Demo Completed (40%) → $6,000 weighted
- $20,000 in Proposal Sent (70%) → $14,000 weighted
Total Weighted Pipeline = $2,000 + $6,000 + $14,000 = $22,000
Why it matters: The Weighted Value of Pipeline strengthens your forecasts by grounding them in data and stage-based probability, leading to more informed decision-making and fewer surprises at the end of the quarter.
25. Deal Slippage Rate
This measures the percentage of deals that get delayed past their expected close date.
Here’s how to calculate deal slippage rate:
Deal Slippage Rate (%) = (Number of Slipped Deals / Number of Deals Expected to Close) × 100
Why it matters: Slippage affects revenue predictability and may indicate poor deal qualification, ineffective USP, or stalled communication.
26. New vs. Upsell Revenue
This compares how much of your revenue comes from new customers versus existing clients.
Here are formulas to remember:
New Revenue Percentage: (New Customer Revenue / Total Revenue) × 100
Upsell Revenue Percentage: (Existing Customer Revenue / Total Revenue) × 100
Why it matters: Balancing acquisition and expansion is key to long-term growth.
Customer Satisfaction Metrics
Sales doesn’t end at the close—it continues through every customer interaction that follows. Tracking customer satisfaction metrics helps you understand the long-term impact of your sales process.
These metrics show how well you’re meeting customer expectations and whether your efforts are building lasting relationships.
When you pay close attention to these numbers, you’ll be able to improve retention, reduce churn, and increase revenue from your existing customer base.
27. Customer Retention Rate
This measures the percentage of customers who continue doing business with you over a set period.
Formula: Customer Retention Rate (%) = [(Customers at End of Period – New Customers Acquired) / Customers at Start of Period] × 100
Why it matters: Retention is cheaper than acquisition, and loyal customers are more likely to upgrade, refer, and expand.
28. Net Revenue Retention (NRR) Percentage
NRR goes a step further by measuring how much recurring revenue you retain from existing customers over time, including expansions (upsells, cross-sells) and subtracting downgrades and churn. This is a revenue-weighted view of retention.
Here’s the NRR formula expressed in further detail:
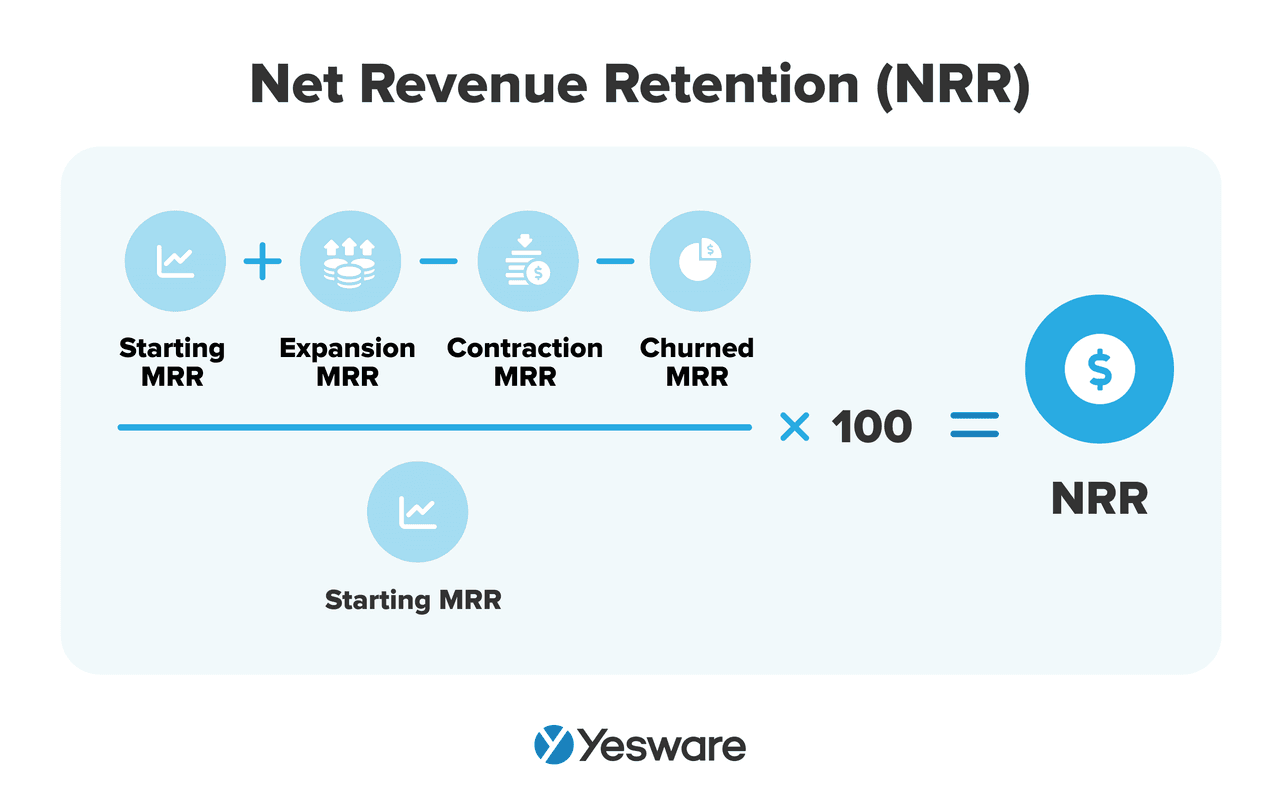
Why it matters: NRR is a very important growth metric. It gives very comprehensive oversight into your offer’s churn, retention, adoption, and expansion rates.
In other words, it gives your team a very good sense of your offer’s momentum in the overall market.
29. Customer Churn Rate
Churn rate is the percentage of customers that decide to break or not renew their contracts after a specific time period.
Here’s the formula to calculate churn rate:
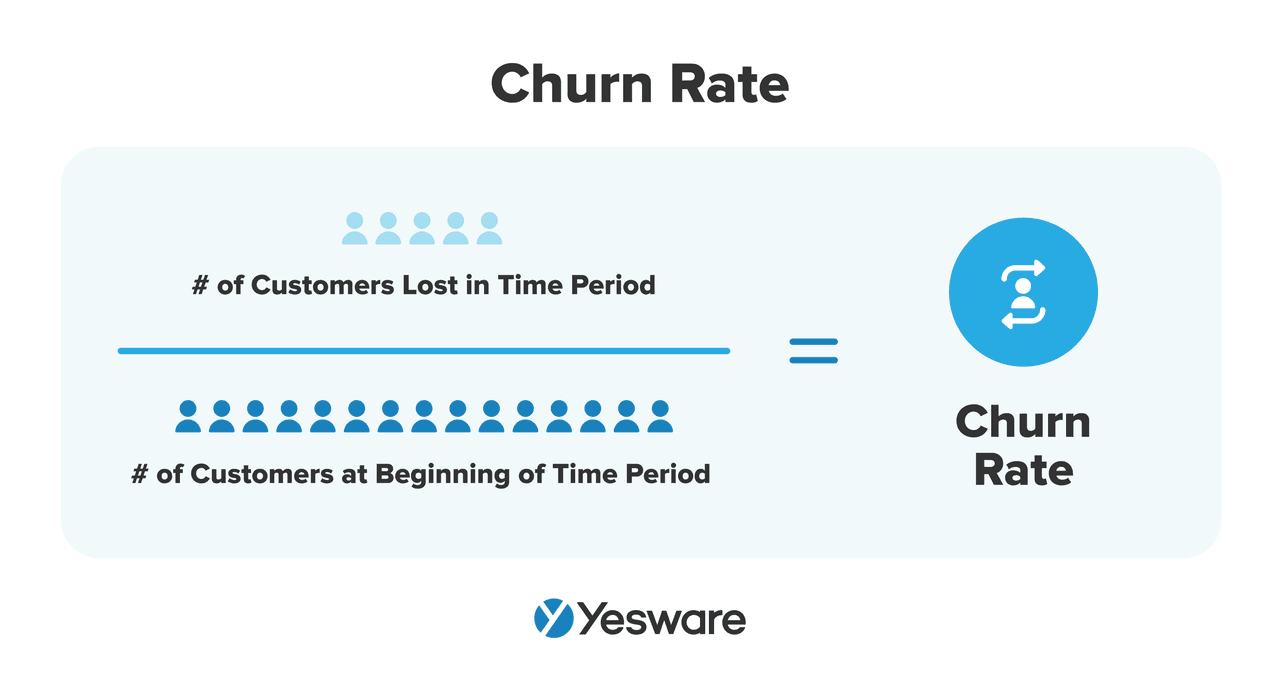
The higher your churn rate, the more of a hit your team will take on revenue.
Why it matters: A high churn rate is a red flag. It might indicate mismatched expectations, onboarding issues, or lack of ongoing value.
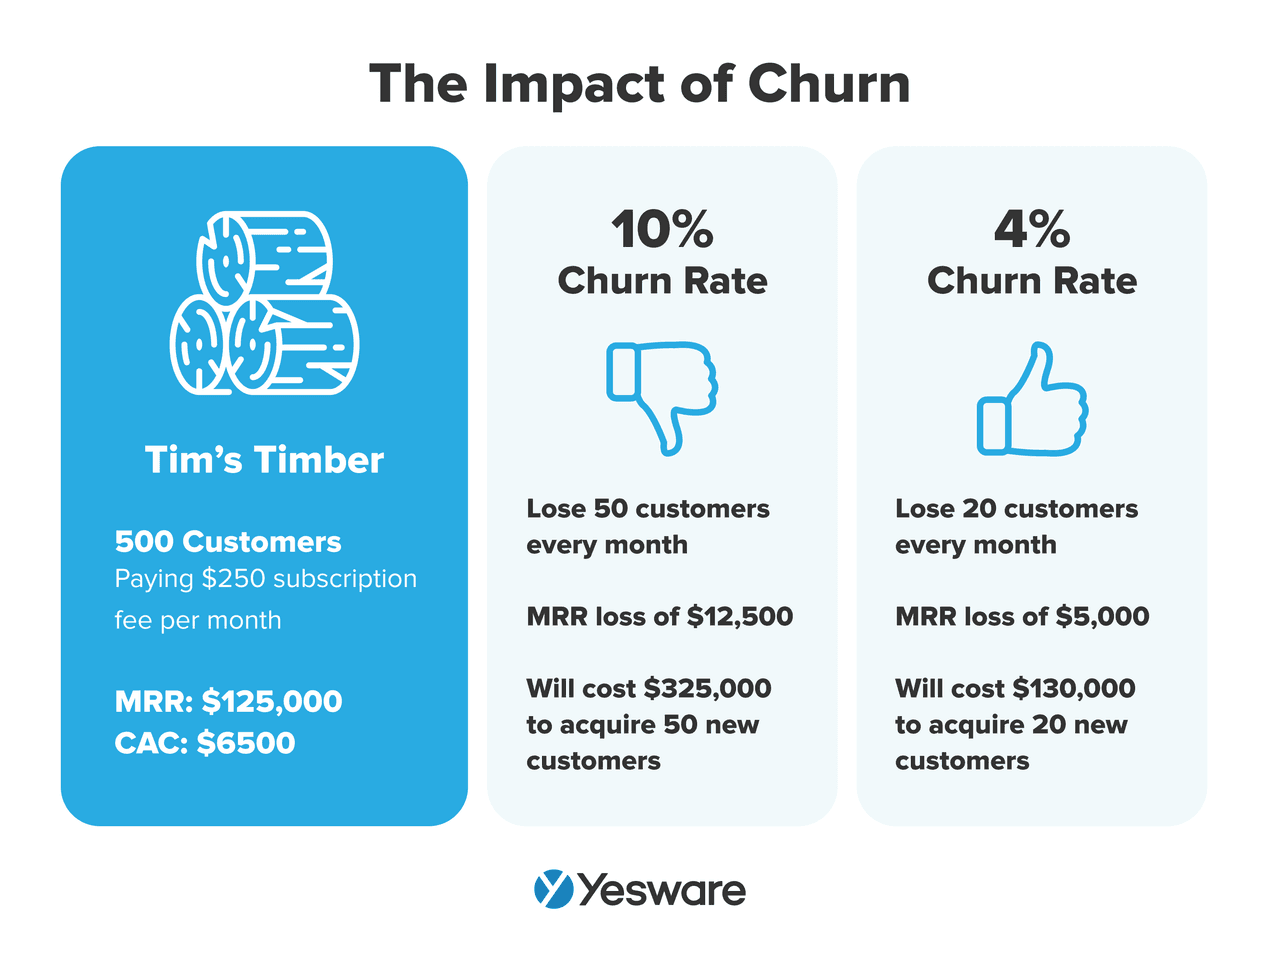
Research shows that it costs anywhere from 5x – 25x as much money to acquire a new customer as it does to retain an existing one. That means that every customer that churns costs a significant amount to replace.
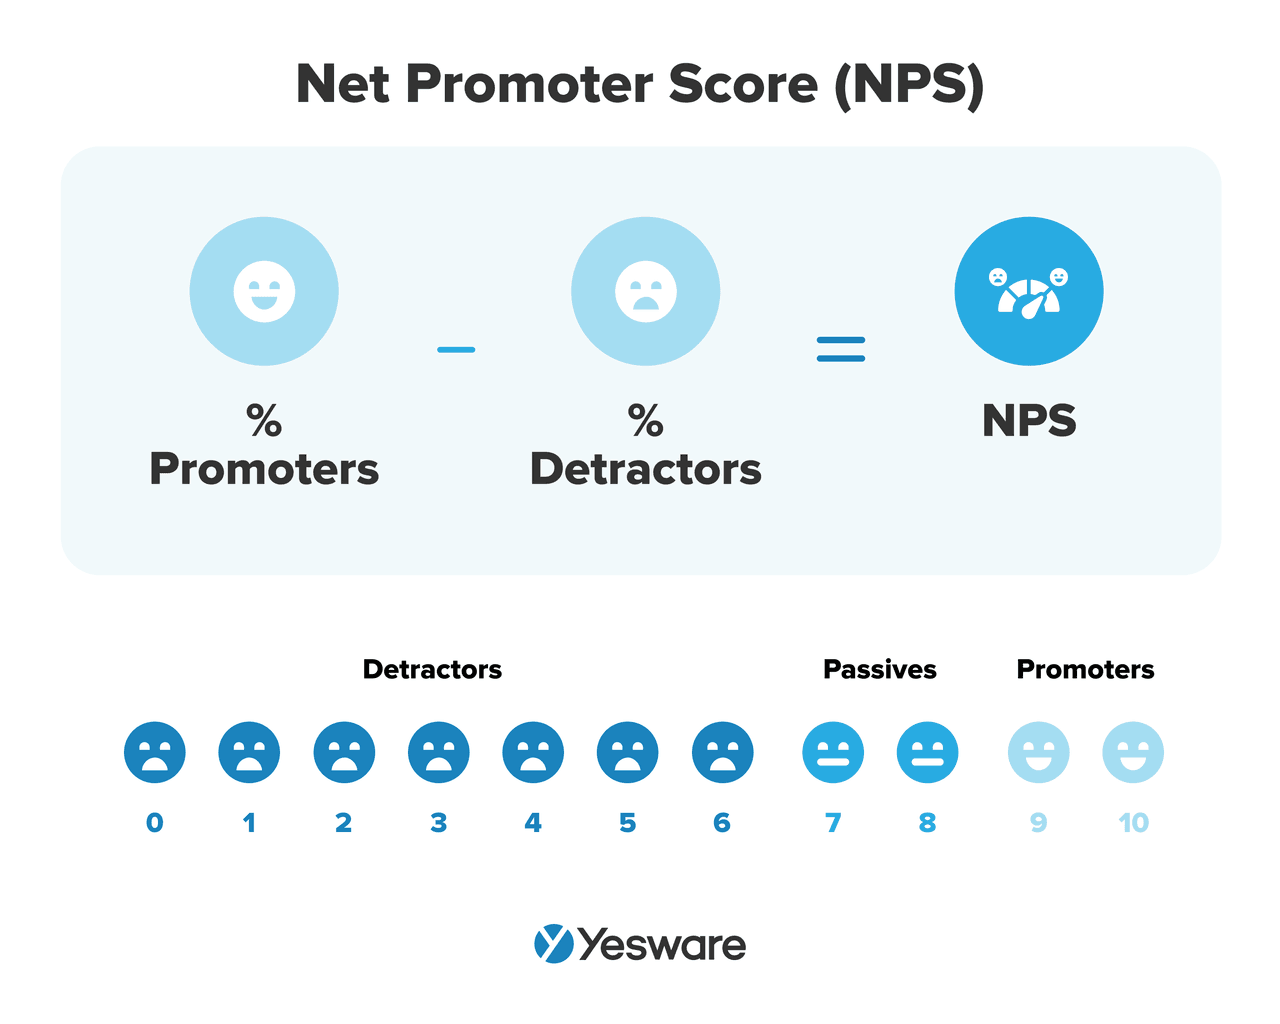
30. Net Promoter Score (NPS)
The net promoter score (NPS) is a general measure of how loyal your customer base is to your brand.
The NPS is based on a customer survey that asks how likely a customer would be to recommend the brand to someone else.
To calculate your brand’s NPS, your team first needs to distribute a customer survey asking how likely each of your clients would be to recommend your product or service to a friend. Most companies give customers the option to respond on a scale of 1 – 10.
The 1-10 scale is broken into three categories:
- Promoters: Customers who respond with a 9 or a 10. These are your most loyal and enthusiastic customers.
- Passives: Customers who responded with a 7 or 8. These customers are satisfied but not actively recommending your brand.
- Detractors: Customers who respond anywhere from 0 – 6. These customers are unhappy and may cause damage to your brand by sharing negative experiences.
To determine the sales metric, subtract the percentage of Detractors from the percentage of Promoters. This is your NPS.
Here’s the formula to calculate NPS:
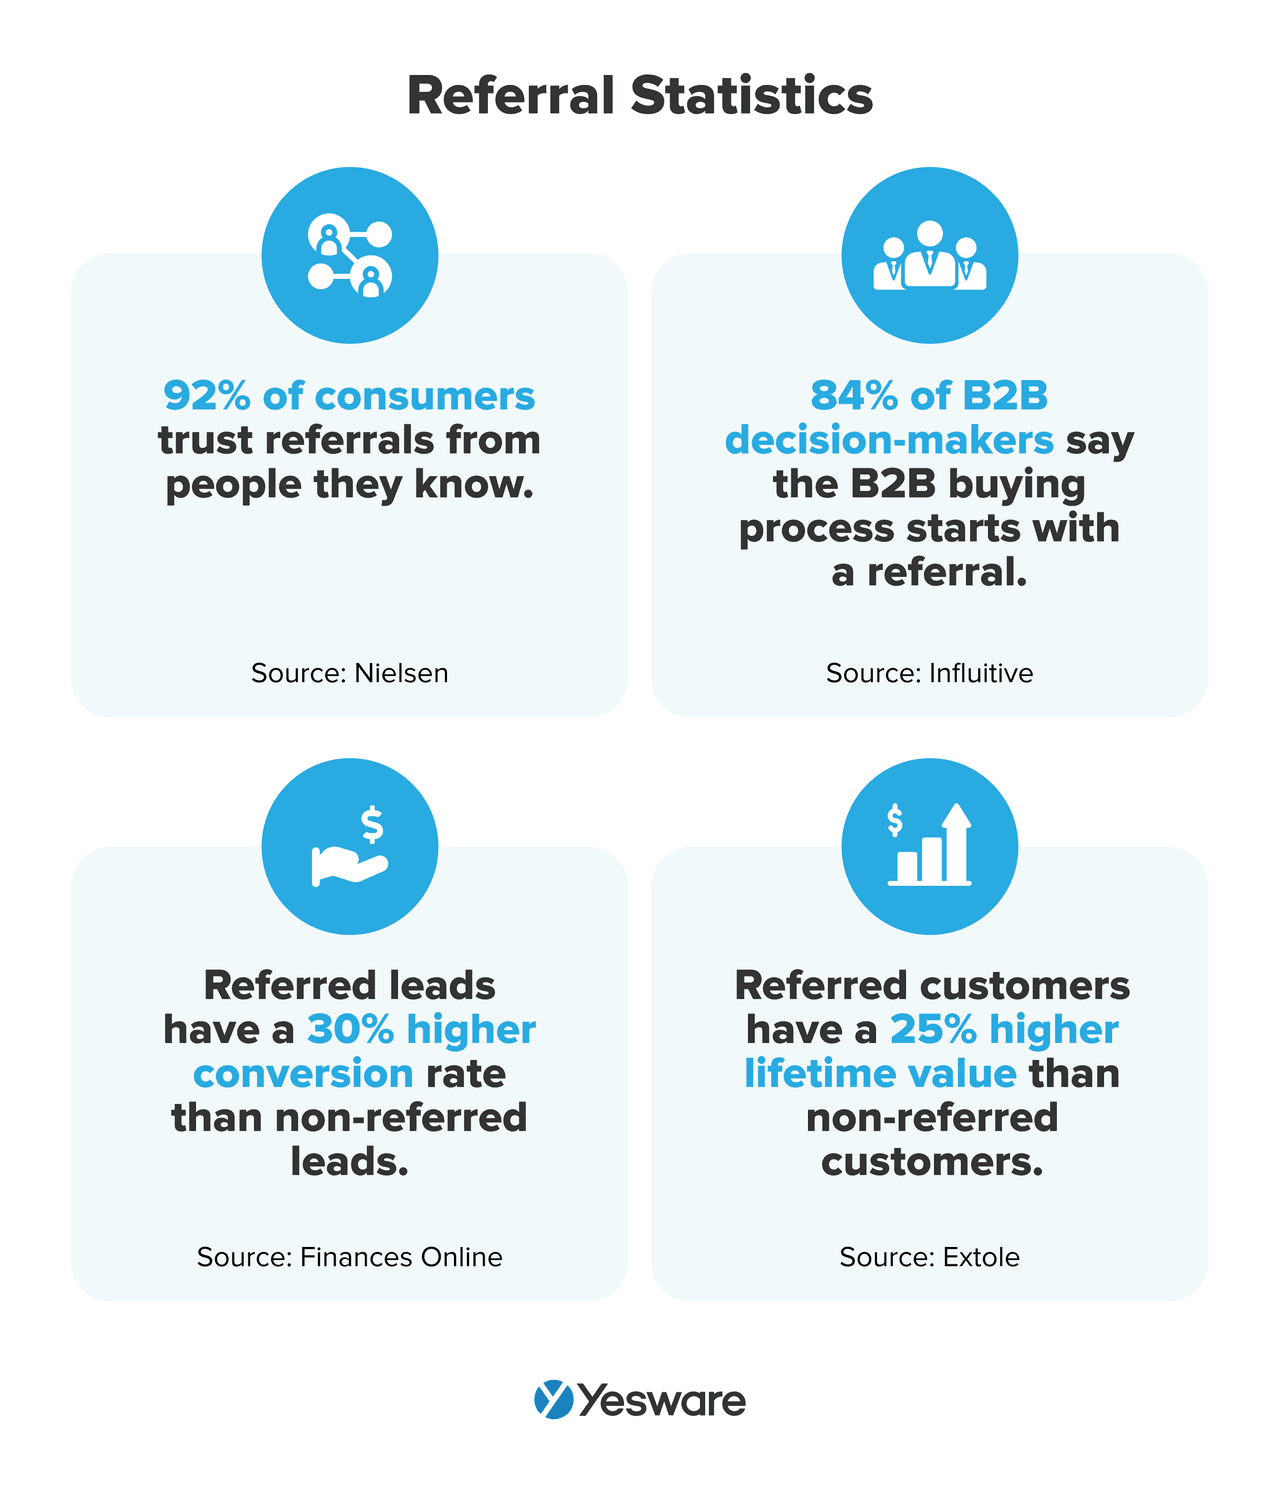
Why it matters: The importance of Promoters (also sometimes called brand ambassadors) cannot be understated in today’s hyper-social sales world — referred customers are like gold for B2B organizations.
Many companies overlook the simple step of distributing a one-question customer survey, and would be well-served by the data their NPS provides. If you don’t know your organization’s NPS, send out a survey ASAP to get the process going.
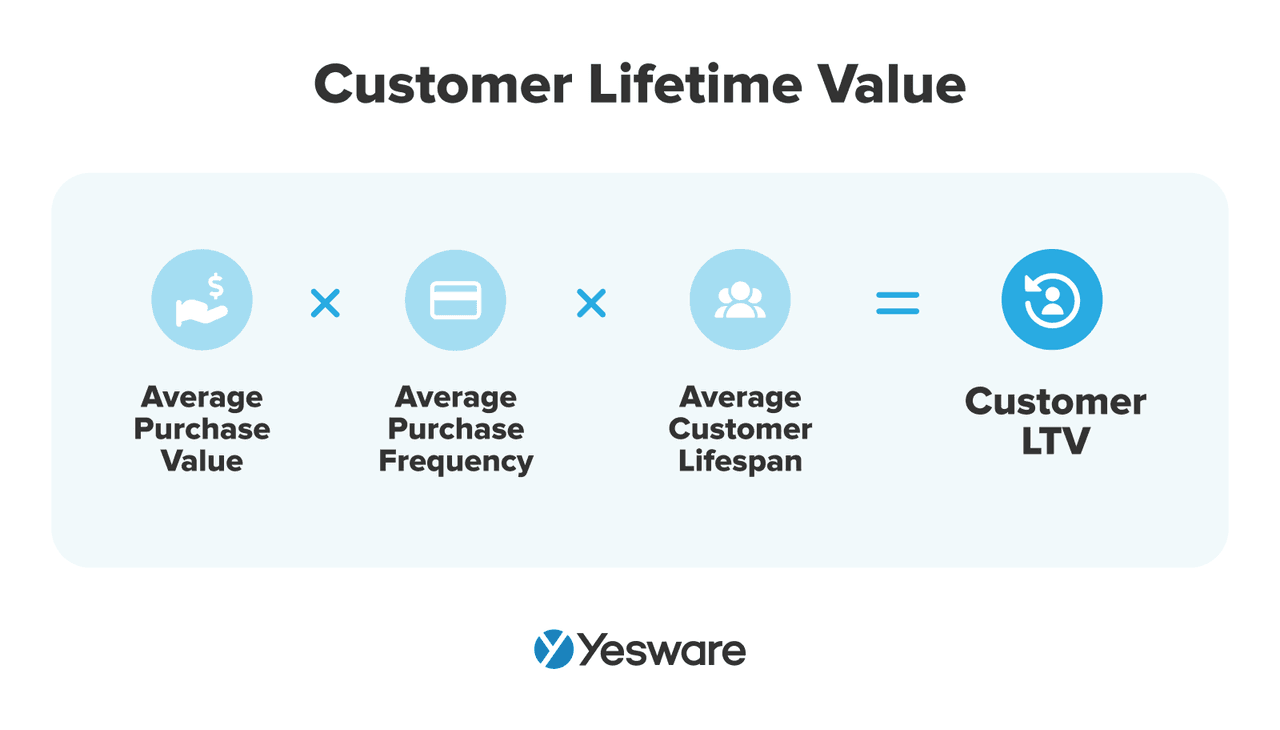
31. Customer Lifetime Value (CLTV)
Average customer LTV represents the average total revenue that a customer generates throughout their contract with your business.
Here’s the formula to calculate customer LTV:
Why it matters: Understanding CLTV helps you prioritize high-value accounts and guide upsell strategy.
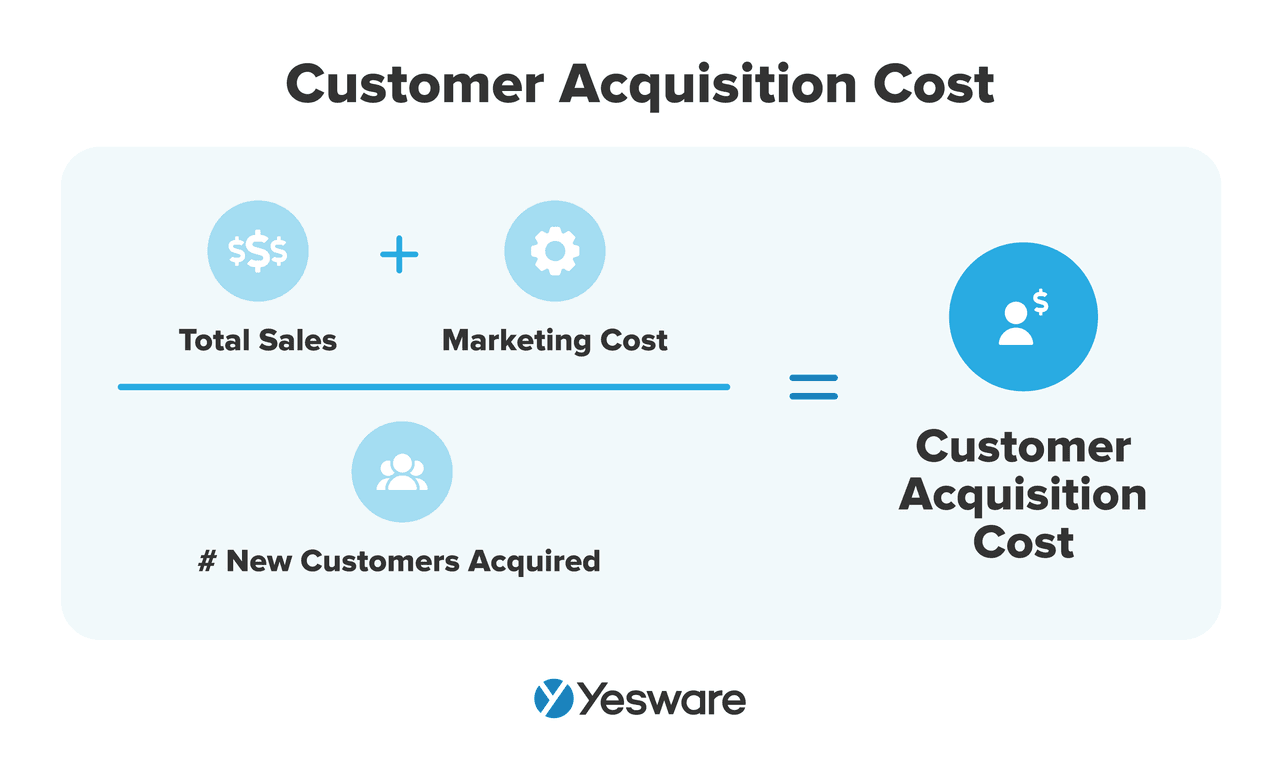
32. Customer Acquisition Cost (CAC)
This measures how much it costs to acquire each new customer—factoring in marketing, sales, and onboarding expenses.
Here’s the formula to calculate CAC:
Why it matters: The lower your CAC relative to CLTV, the more profitable your sales process is.
33. Customer Satisfaction Score (CSAT)
This is typically measured by asking customers to rate their satisfaction with your product, service, or support.
CSAT is typically collected through a short post-interaction survey. Customers are asked a simple question such as:
“How satisfied were you with your experience today?”
They respond using a scale, most commonly:
- 1 to 5 (1 = Very Dissatisfied, 5 = Very Satisfied)
- Or 1 to 10 (1 = Not at all satisfied, 10 = Extremely satisfied)
The company then focuses on responses rated in the top range (e.g., 4 or 5 on a 5-point scale) to calculate the percentage of satisfied customers.
Here’s a formula:
CSAT (%) = (Number of Satisfied Responses / Total Responses) × 100
If 80 out of 100 customers respond to your survey and 68 of them give a 4 or 5:
CSAT = (68 / 80) × 100 = 85%
That means 85% of respondents were satisfied with their experience.
Why it matters: It provides a quick health check on the customer experience.
34. Renewal Rate
This tracks the percentage of customers who renew their subscriptions or contracts at the end of the term.
Formula: Renewal Rate (%) = (Number of Customers Who Renewed / Number of Customers Up for Renewal) × 100
Why it matters: It reflects customer satisfaction, ongoing value, and relationship strength.
Sales Tracking Tools
If you want to consistently hit your numbers, you can’t rely on spreadsheets and guesswork. You need reliable, data-driven tools that help you track every touchpoint, deal, and metric in real time.
Sales tools empower you to work smarter, stay organized, and make better decisions based on evidence, not assumptions.
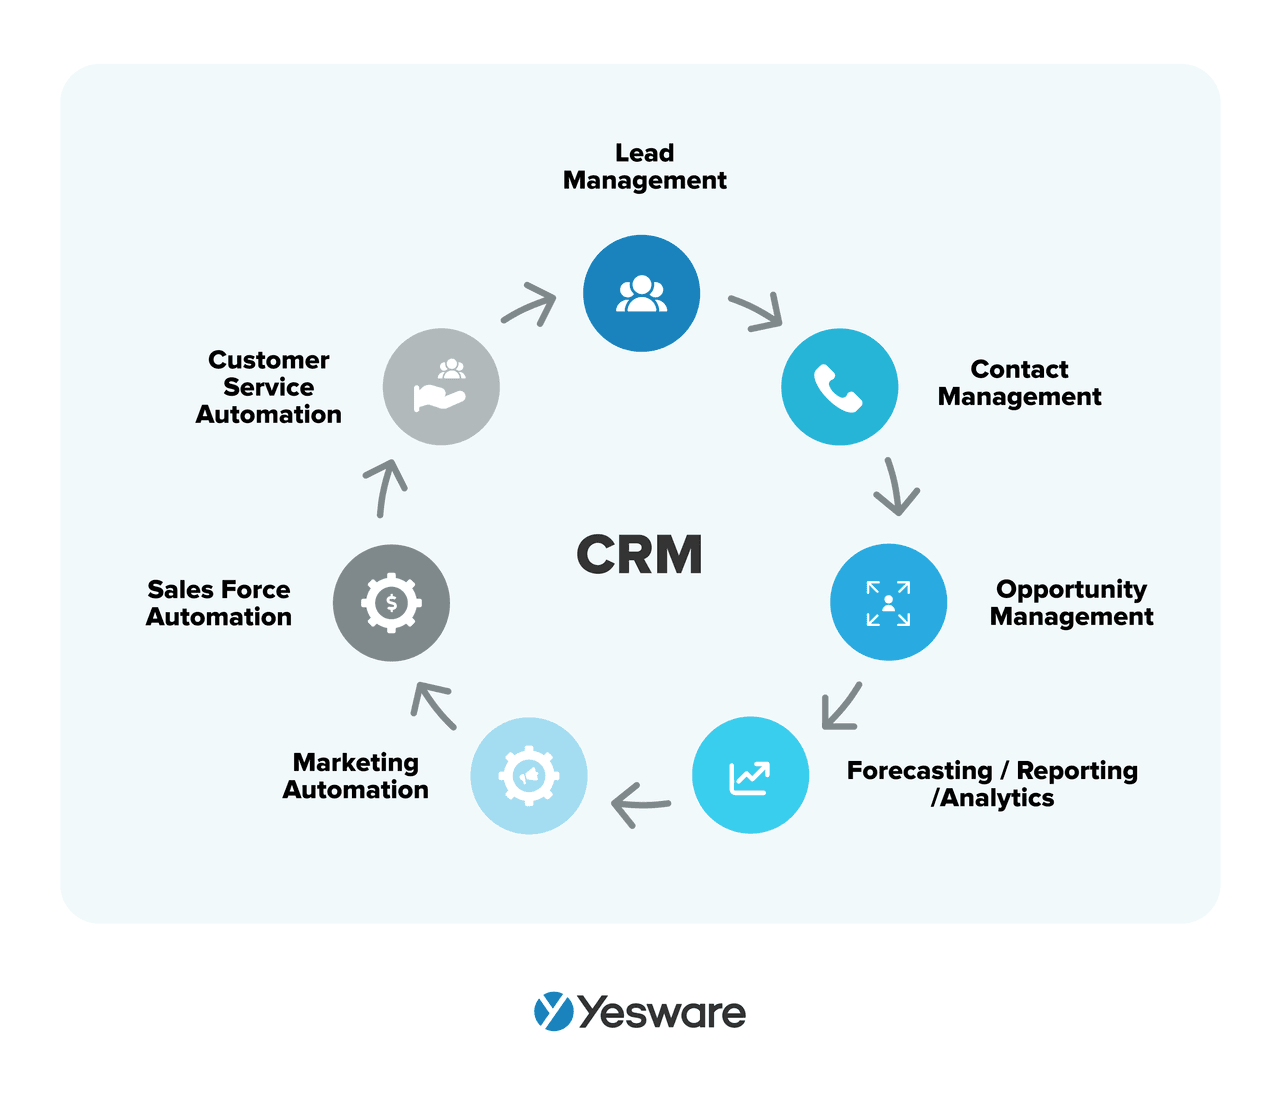
1. Customer Relationship Management (CRM) Systems
What it does: CRM centralizes all your contact data, deal records, sales stages, and communication history.
Popular tools: Salesforce, HubSpot CRM, Zoho CRM, Pipedrive, Vendasta CRM.
How it helps you:
- Manage your pipeline and deal stages visually.
- Track lead activity and rep performance across accounts.
- Generate reports on quota attainment, sales velocity, and forecast accuracy.
Pro tip: Make sure your CRM integrates with your other sales tools so you avoid double data entry.
2. Sales Engagement Platforms
What it does: Helps automate and personalize outreach across multiple channels (email, phone, LinkedIn), while tracking engagement.
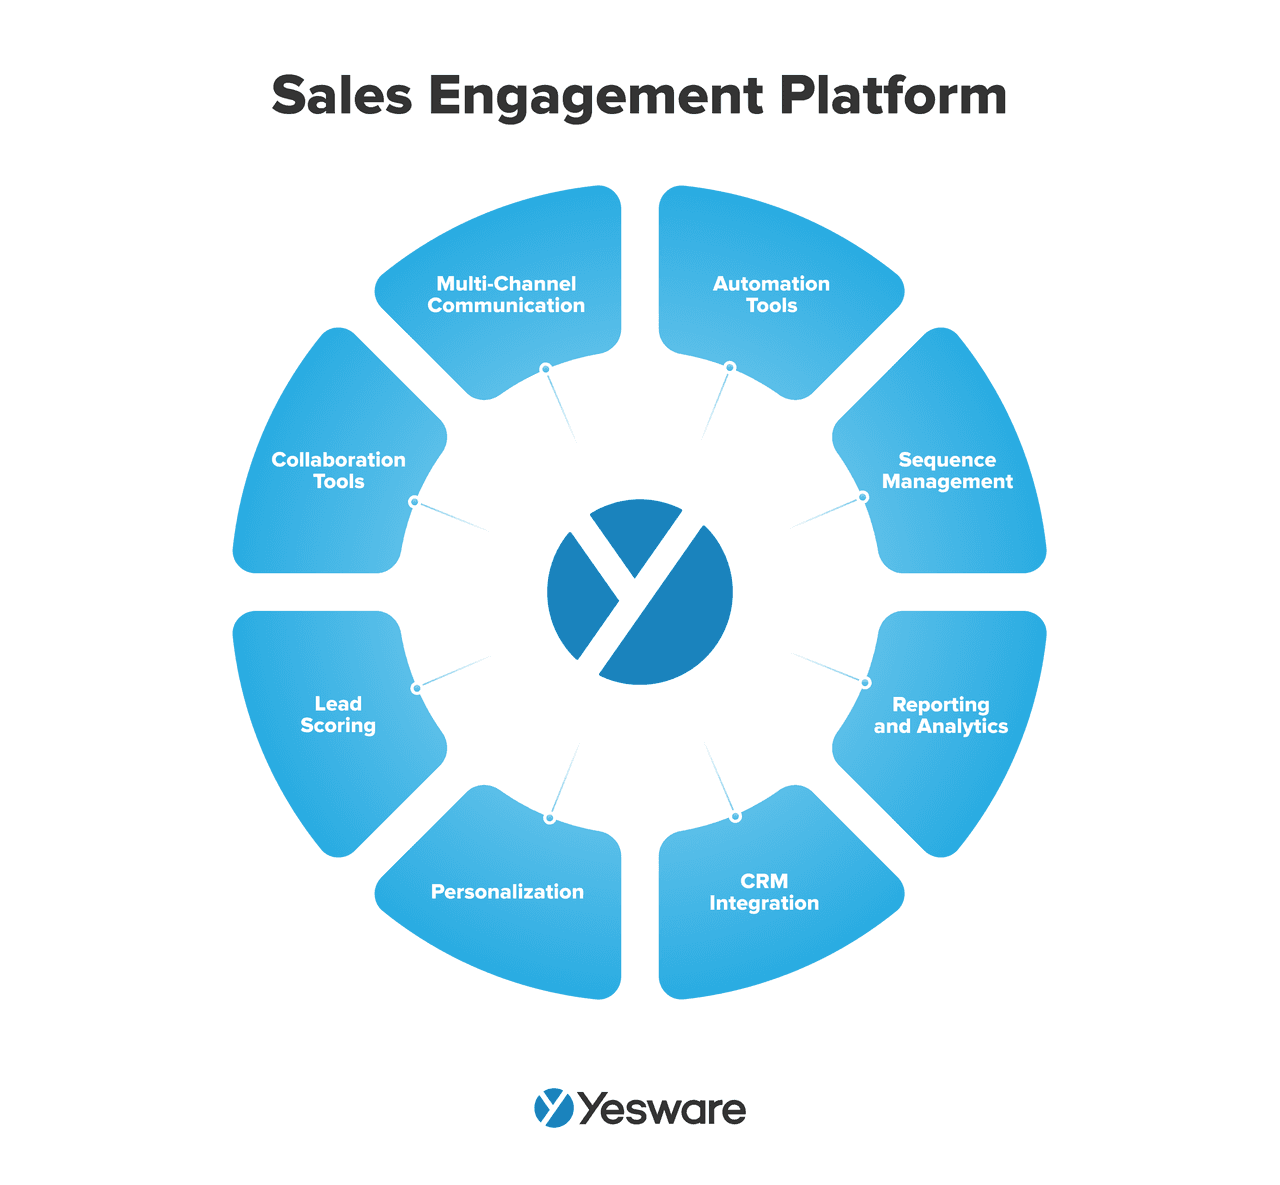
Popular tools: Yesware, Outreach, Salesloft, Apollo.
How it helps you:
- Set up multi-touch cadences that scale your outreach.
- Track email opens, clicks, and replies.
- Prioritize leads based on real-time engagement.
Pro tip: Use engagement data (like open and reply rates) to improve messaging and timing over time.
3. Email and Calendar Integration Tools
What it does: Syncs your inbox and calendar with your CRM and scheduling workflows.
Popular tools: Yesware, Calendly, Chili Piper, Google Workspace, Microsoft Outlook integrations.
How it helps you:
- Automatically log calls, emails, and meetings.
- Book meetings faster with shareable scheduling links.
- Avoid back-and-forth and eliminate manual follow-up tracking.
4. Sales Analytics and Dashboards
What it does: Visualizes your sales performance metrics and pipeline health so you can spot trends and adjust quickly.
Popular tools: Salesforce Reports, Tableau, Databox, InsightSquared.
How it helps you:
- Monitor KPIs like win rate, deal slippage, and sales cycle length.
- Compare performance by rep, region, or product.
- Identify bottlenecks in your sales funnel.
5. Forecasting Tools
What it does: Uses historical data and AI modeling to project future revenue.
Popular tools: Clari, BoostUp, InsightSquared, Salesforce Forecasting.
How it helps you:
- Set realistic sales targets.
- Improve forecast accuracy with weighted deal values.
- Align reps, managers, and leadership around expectations.
Frequently Asked Questions (FAQ)
What are sales metrics?
Sales metrics are quantifiable data points that measure various aspects of sales performance, such as outreach activity, pipeline health, revenue generation, and customer retention. They help sales teams understand what’s working, identify bottlenecks, and optimize for better outcomes.
What’s the difference between sales metrics and KPIs?
All KPIs are sales metrics, but not all sales metrics are KPIs. KPIs (Key Performance Indicators) are the most critical metrics that align directly with your strategic goals. For example, total calls made is a sales metric, while win rate might be a KPI if your team is focused on improving conversion efficiency.
How many sales metrics should I track?
It’s not about quantity—it’s about relevance. Focus on a balanced mix of leading and lagging indicators across three core categories: sales activity, sales performance, and customer satisfaction. Start with a manageable set (5–10) and expand based on your team’s goals and maturity.
What’s the most important sales metric for forecasting?
One of the most reliable metrics for sales forecasting is the Weighted Value of Pipeline, which accounts for the probability of deal closure at each stage. Pairing this with historical win rates and forecast accuracy gives you a more dependable projection.
How do I know if my sales metrics are effective?
Your metrics are effective if they are:
- Aligned with team and company goals.
- Easy to measure and interpret.
- Actionable—leading to performance improvements.
- Trackable over time for trend analysis and decision-making.
Which tools help track sales metrics most effectively?
Some of the best tools for tracking sales metrics include:
- Yesware – for engagement tracking, outreach automation, and meeting scheduling.
- Vendasta CRM, Salesforce, HubSpot – for CRM and pipeline tracking.
- Clari or InsightSquared – for forecasting.
- Google Sheets or Databox – for customizable dashboards and reports.
Conclusion: Start Tracking What Actually Moves the Needle
You don’t need more data—you need better data. By tracking the right sales metrics, you give yourself the power to make confident decisions, forecast with accuracy, and build a scalable sales engine.
Whether you’re trying to improve outreach effectiveness, shorten your sales cycle, or boost retention, having clear, actionable insights is the difference between guessing and growing.
Yesware makes it easy to track activity, engagement, and performance—without interrupting your workflow. From email tracking and templates to campaign analytics and meeting booking, Yesware keeps your pipeline moving and your numbers within reach.
Try Yesware free and see the impact of smarter sales tracking firsthand.
This guide was updated on May 27, 2025.
Get sales tips and strategies delivered straight to your inbox.
Yesware will help you generate more sales right from your inbox. Try our Outlook add-on or Gmail Chrome extension for free, forever!
Related Articles


Casey O'Connor
![Sales Velocity: What It Is + How to Calculate It [Examples]](/blog/_next/image/?url=https%3A%2F%2Fwww.yesware.com%2Fwp-content%2Fuploads%2F2022%2F03%2Fsales-velocity-yesware.jpg&w=1280&q=75)
Casey O'Connor

Casey O'Connor
Sales, deal management, and communication tips for your inbox